- Home
- About
- Support
- Data Access
- Data Analysis
- Data Products
- Publications
-
Links
Databases NED Simbad GCN circulars archive GRB data table Software & Tools Swift Software (HEASoft) Xanadu WebPIMMS Institutional Swift Sites GSFC PSU OAB SSDC MSSL University of Leicester
Optical Loading
Bright optical sources can cause significant charge in the CCD, affecting the on-board detection of X-rays. Above a certain level this manifests itself by producing spurious events; for optically brighter sources it affects the X-ray event energy calibration and grade, and very bright objects can cause X-ray events to be rejected (see examples). The graphs below indicate V-band magnitude at which sources start producing spurious events. We also provide a web tool to determine whether a specific object is likely to cause a problem.
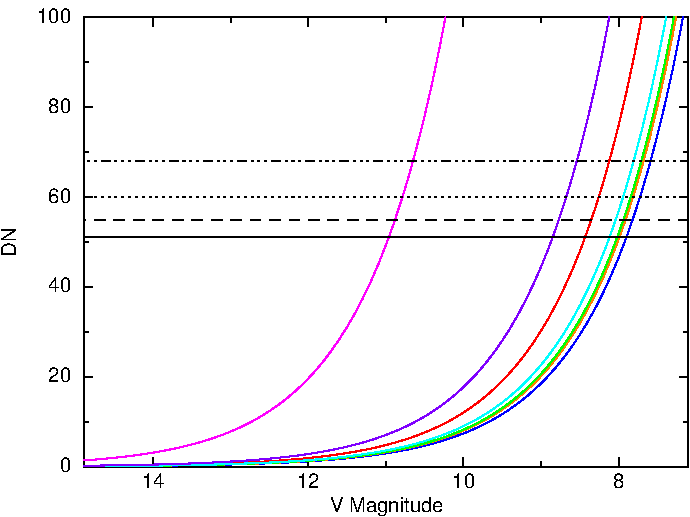
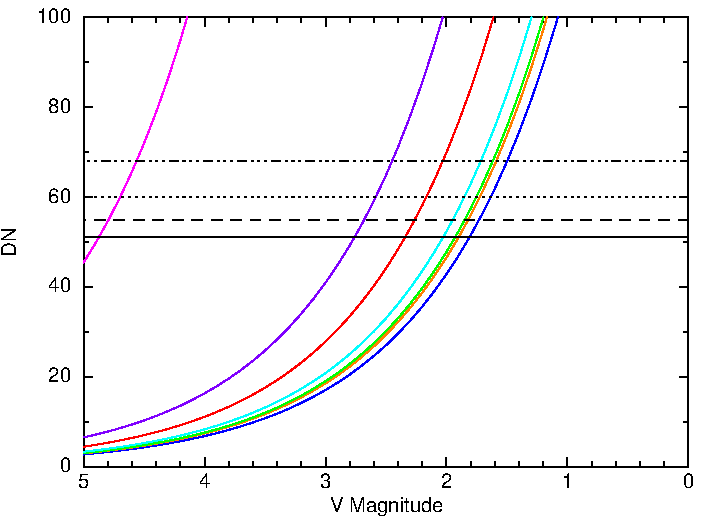
The graphs show DN caused by optical photons, as a function of V-band magnitude (DN is the raw output of the CCD). This is different for the two XRT operating modes, as Windowed Timing (WT) mode has a readout time ~1500 times shorter than Photon Counting (PC) mode. Due to the wavelength-dependent response of the XRT CCD, the impact of optical loading is a function of stellar type, so various main-sequence stellar types are shown. The horizontal lines indicate the DN-level at which an optical source starts to contaminate the data: points above the horizontal line will contribute spurious X-ray photons at some level; the four lines show 4 different count-rates for the spurious photons. Which level is relevant depends on the expected X-ray count-rate of the source in question, and the exposure time. e.g., if you are studying a source with an X-ray flux of 1 ct/sec, then optical loading at a level of a ~a few × 10-2 may be acceptable; but if you are searching for faint sources in deep exposures, optical loading at 10-4—10-3 ct/sec is likely to be contaminate your results.
The key to the graphs is given here, more details are below the graphs.
| Which line | Count rate of spurious events |
|---|---|
| Solid (bottom) | 10-4 ct s-1 |
| Dashed (one from bottom) | 10-3 ct s-1 |
| Dotted (one from top) | 10-2 ct s-1 |
| Dash-dotted (top) | 10-1 ct s-1 |
The stellar types, reading left to right off the graph (and by colour) are:
- Magenta: M8
- Purple: M0
- Red: K0
- Cyan: G0
- Green: F0
- Orange: A0
- Blue: B0
PC Mode
WT Mode
Detailed explanation
Optical photons that penetrate the blocking filter can liberate electrons in the CCD. The camera electronics read out the number of electrons liberated in each pixel, and convert it into a Digital Number (DN). The X-ray event recognition only accepts pixels with DN in the range 80—4095. Thus, if an optical source produces sufficient photons to generate at least 80 DN in a single pixel between successive CCD read-outs, the electronics will believe that the electrons were caused by an X-ray photon, and thus record a spurious event.
To determine the level at which this optical loading is important we therefore establish how bright a source has to be to have some defined probability of producing 80 DN from optical photons, in a single frame. This depends on the duration of the CCD frames (2.5 s for PC mode, 1.76 ms for WT mode) and the fraction of the optical light that falls in the central pixel of the PSF (0.28 for PC mode and 0.37 for WT mode). That is, we need to find where the probability of getting 80DN is:
P(80DN) = count_rate × frame_exposure × PSF_in_peak pixel
So for PC mode, if we want to limit optical loading to 10-4 ct/sec we need to identify the optical brightness such that:
P(80DN)=10-4 × 2.5 × 0.28 = 7×10⁻⁵
We therefore want to find the mean count-rate, x, where the Poisson distribution gives
P(80|x)=7×10⁻⁵ which we find to be 51 DN.
To determine the source brightness at which this happens, we
follow a procedure analogous to that done for XMM (Lumb.
2000). We assume a star's spectrum to be approximately a
blackbody, controlled by two parameters: the bolometric correction
(mbol-mV) and the effective
temperature. We then integrate the spectrum between 11000 Å
and 4000 Å (the red limit defined by the energy needed to
liberate an electron in silicon, the blue limit set by the CCD
response falling off), and fold it through the XRT filter
tranmission curve, the CCD effective area and the mirror geometric
area. This then tells us how many photons are detected by the CCD
per second. At these wavelengths one photon causes a single electron
to be liberated in the CCD. The DN produced by the electronics is
given by
DN=Ne * 3.65/gain where
the gain=2.67 eV/DN at launch (and evolves slowly with
time). We can then determine the V-band magnitude of the star
necessary to obtain a given DN from optical loading.
This page, revised in 2012 August 8, provides a more complete description of optical loading, its significance, and how to calculate when it matters than was previously available. While the details given in this page have been revised, the impact on optical loading on observations has not changed through the life of Swift.
Verification
To confirm that these levels are correct we examined several fields where optical loading is present. We found the stellar type and V-magnitude of the object from SIMBAD, and measured the count-rates of the object in XRT. We then used the Optical Loading Calculator to determine the magnitude at which a star of this type is expected to contribute photons at the measured rate, and confirmed that the actual magnitude of the star was at least at this level. The table below shows, for 5 such stars, the measured XRT count rate, the details of the optical source, and the magnitude at which the Optical Loading Calculator sets the warning for that combination of count-rate and stellar type. In all cases, the warning level is at a fainter magnitude than the actual magnitude of the star, showing that the tool is working correctly, albeit slightly conservatively.
Notes
- The reported X-ray count-rates are from the unfiltered event lists. This is higher than in the cleaned event lists.
- The Optical Loading Calculator only calculates from low intensities up to the point where the mean emission from the optical source is 80DN, since at this point observations will be heavily contaminated by optical loading. This corresponds to an optical loading-induced count rate of 0.7 ct/sec in PC mode and 720 ct/sec in WT mode. Therefore in the table below, if the predicted optical count-rate exceeds this level, the magnitude limit calculated is appropriate for 0.7 ct/sec, rather than the measured rate.
| XRT rate ct/sec | Star details | Warning level V mag |
|---|---|---|
| 0.0096 | K2 III, V=7.2 | 8.1 |
| 0.34 | G8 III, V=7.5 | 7.9 |
| >13* | M3 III, V=4.8 | 8.8 |
| >80* | M2 III, V=4.6 | 8.9 |
| 0.37 | K0, V=7.9 | 7.9 |
* These sources are so bright they cause the events in the centre of the PSF to be rejected, so these count-rates are underestimates. However, as Note 2 above points out this is irrelevant because the warning level for this stars refers to any star above 0.7 ct/sec
Severely Optically Loaded Sources
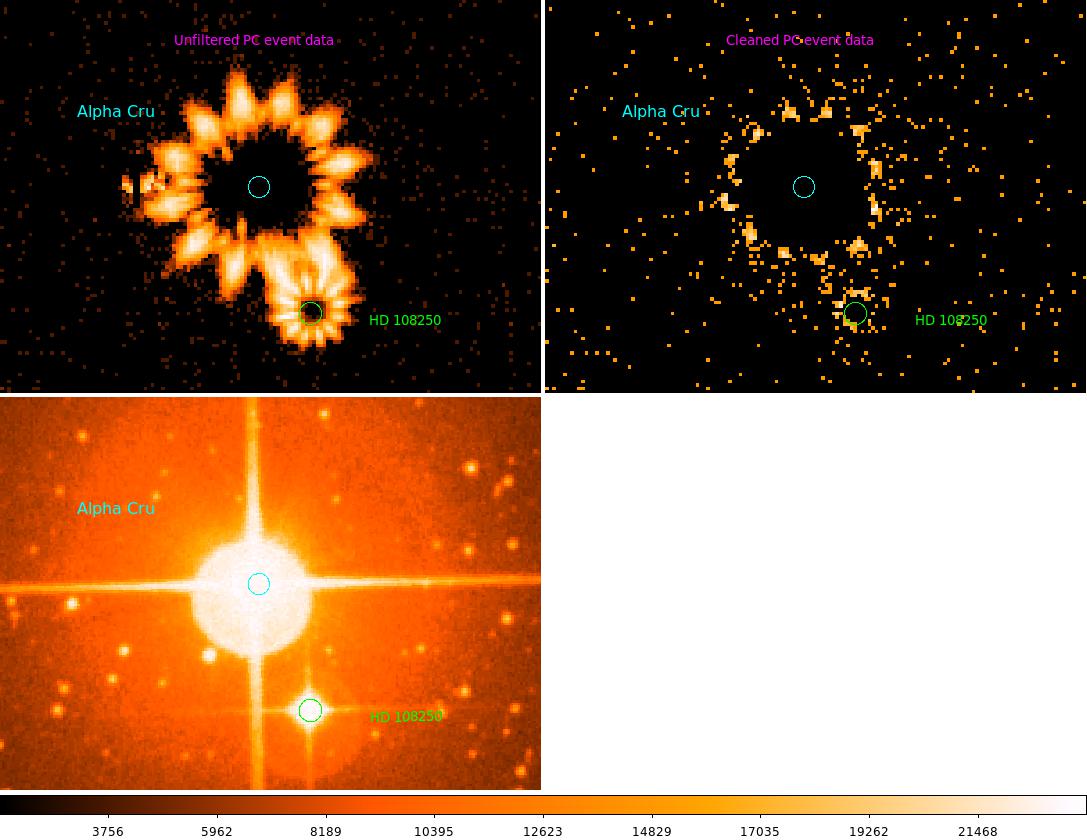
The image above demonstrates an extreme example of optical loading in the XRT band. Both Alpha Cru and HD 108250 are very bright optical sources with V magnitudes of 0.8 and 4.8, respecively. The top left image shows the "raw" (*po_uf.evt) image, while the top right is the cleaned (*po_cl.evt) output. The lower image shows the optical data. A faint ring of "events" survive the pipeline screening, leaving a large hole in the centre. The plot below shows a spectrum extracted from the ring feature, and resembles that produced by hot gas dominated by O VII and O VIII emission lines. This spectrum is not showing actual X-ray events, but rather lots of optical photons hitting each pixel and "piling-up" to reach X-ray energies.
UK Swift Science Data Centre
Last updated 2012 August 08
Web page maintained by Phil Evans
E-mail: swift help
Please read our privacy notice.