- Home
- About
- Support
- Data Access
- Data Analysis
- Data Products
- Publications
-
Links
Databases NED Simbad GCN circulars archive GRB data table Software & Tools Swift Software (HEASoft) Xanadu WebPIMMS Institutional Swift Sites GSFC PSU OAB SSDC MSSL University of Leicester
The Swift-XRT GRB Catalogue
NEW: Guidelines for downloading XRT GRB products in bulk.
This site presents a live, automatically updated version of the principle tables and figures from Evans et al. (2009). If you use these results, please cite that paper (see the usage policy for more information).
To view an individual burst either: 1) Click on the burst name in the table, or
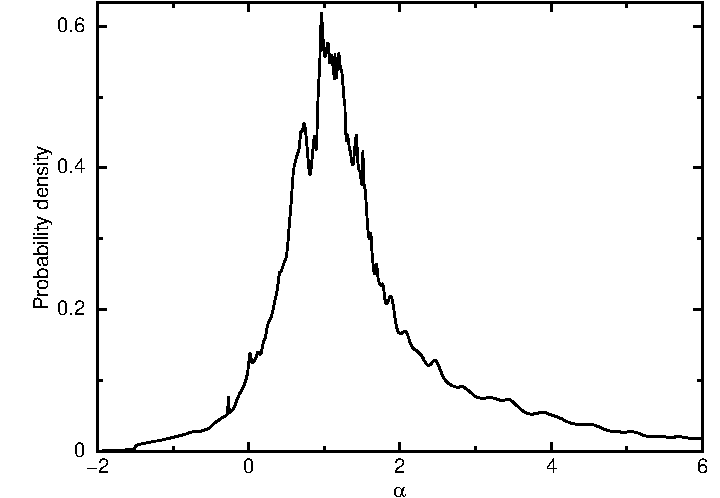
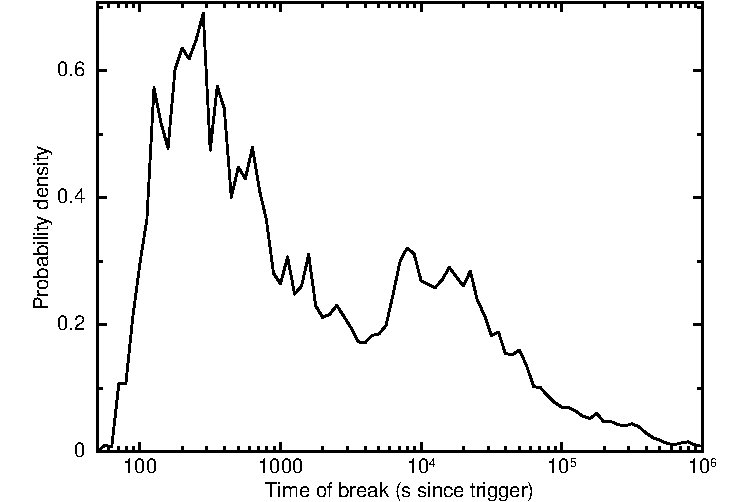
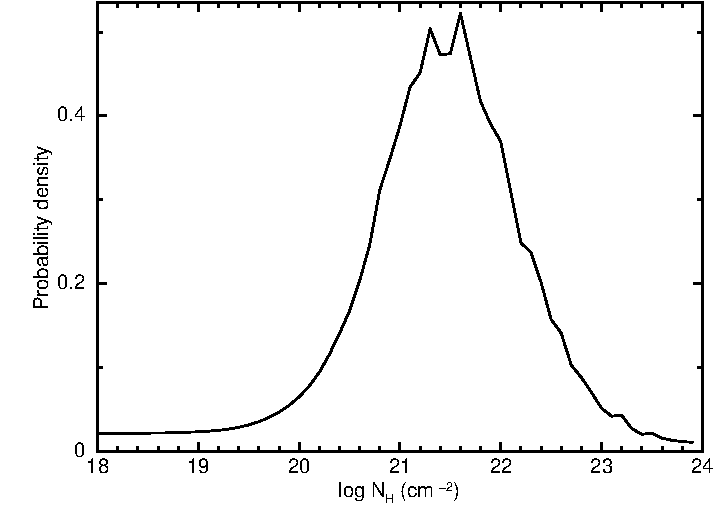
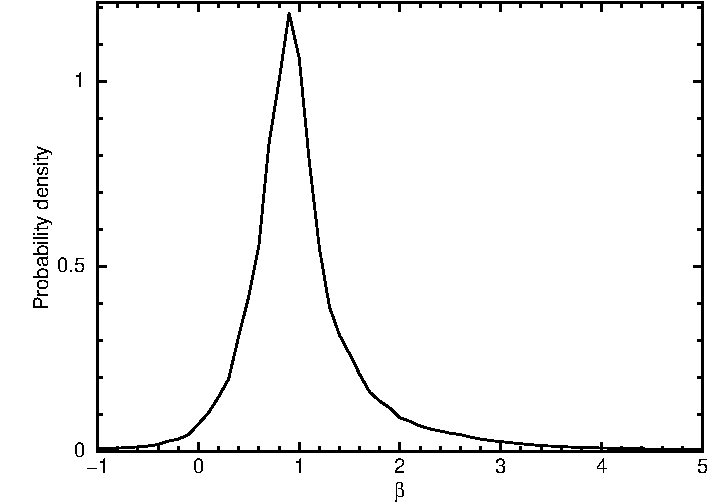
Parameter distributions
The plots below show the probability density functions of the temporal and time-averaged spectral parameters for all GRBs. Click the images for larger versions. These figures correspond to Figs. 5,6, 7a and 8a of Evans et al. (2009). See the PDF documentation for more information.
| Temporal indices | Break Times | NH | Spectral indices |
|---|---|---|---|
 |
 |
 |
 |
| Postscript version | Postscript version | Postscript version | Postscript version |
Closure Relationships
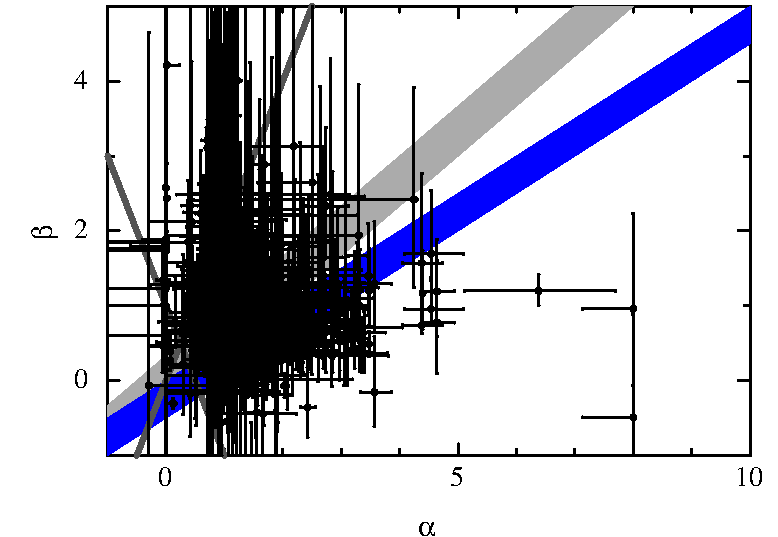
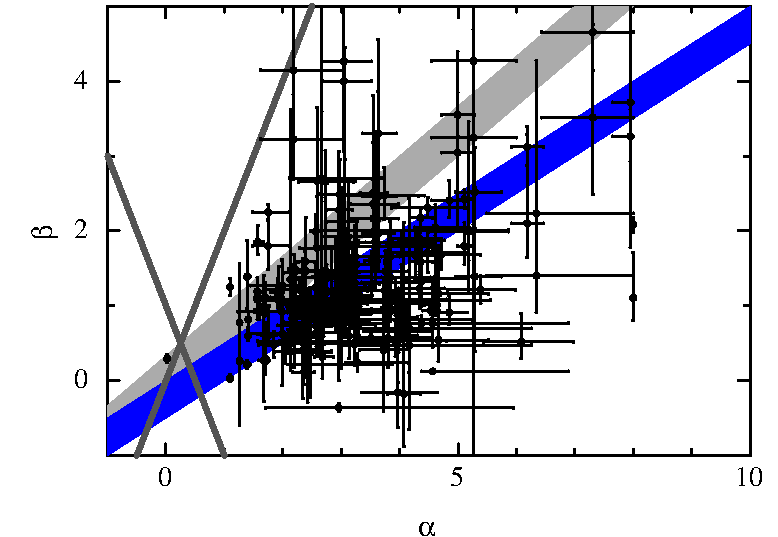
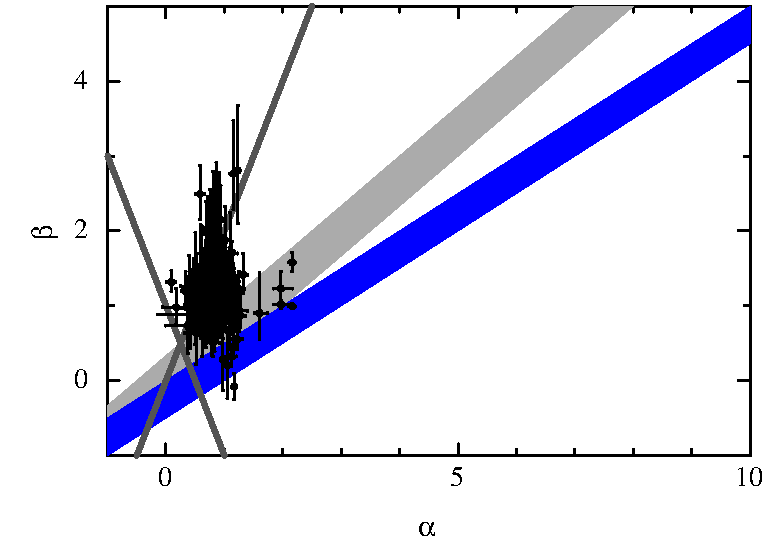
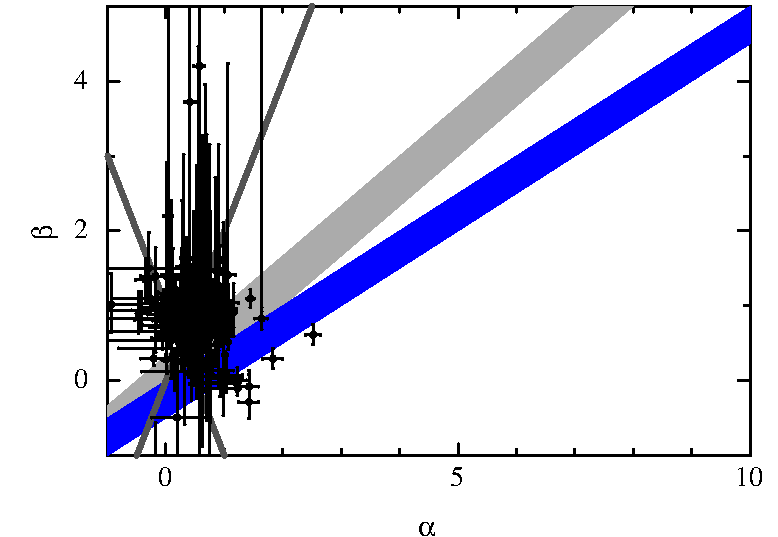
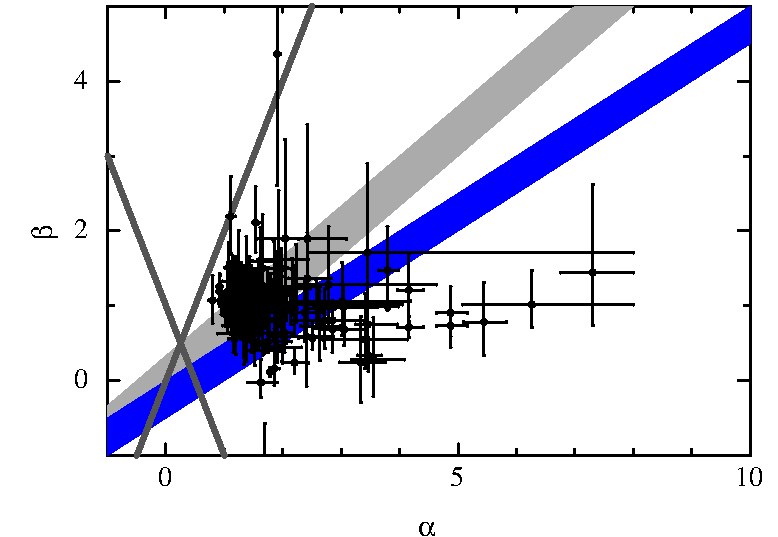
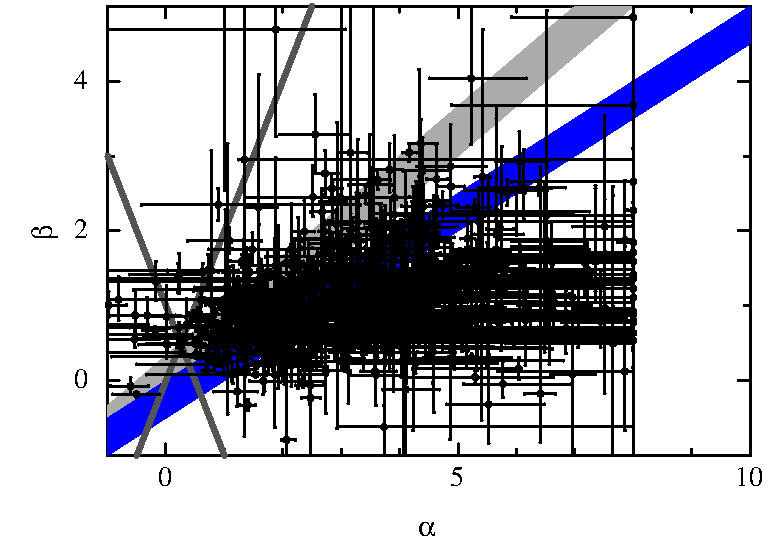
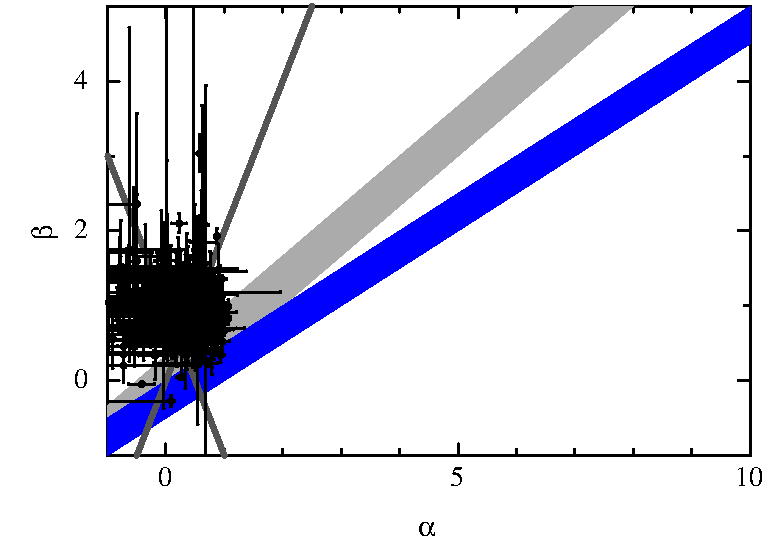
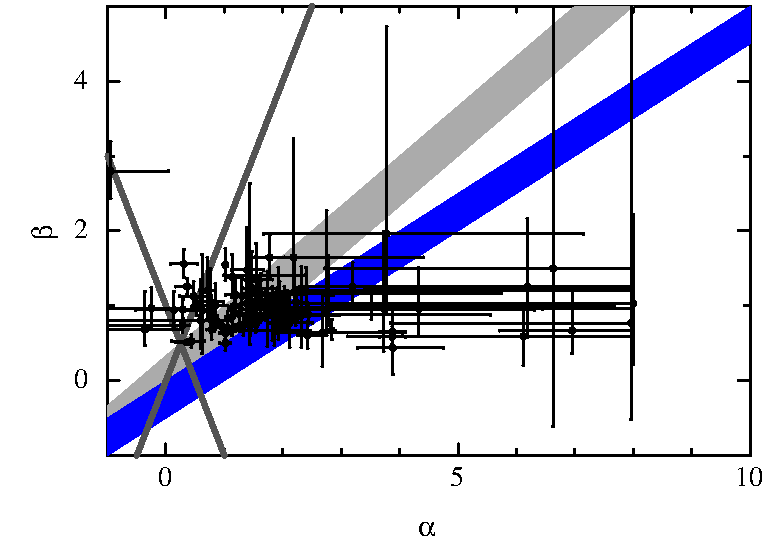
The plots below show (α, β) scatter plots for each of the different types/phases of light curves (see light-curve types), where α and β are the temporal and spectral energy power-law indices respectively. The shaded regions mark those allowed by the standard closure relationships. These figures correspond to Fig. 10 of Evans et al. (2009). See the closure relationship documentation for more information.
| No break | |||
|---|---|---|---|
 | |||
| Postscript version | |||
| One-break, steep first Steep phase | One-break, steep first Shallow phase | ||
 |  | ||
| Postscript version | Postscript version | ||
| One-break, shallow first Shallow phase | One-break, shallow first Steep phase | ||
 |  | ||
| Postscript version | Postscript version | ||
| Canonical Steep phase | Canonical Plateau | Canonical 'Normal' | Canonical Post jet-break |
 |  |  |  |
| Postscript version | Postscript version | Postscript version | Postscript version |
UK Swift Science Data Centre
Last updated 2011 Oct 5
Web page maintained by Phil Evans
E-mail: swift help
Please read our privacy notice.