- Home
- About
- Support
- Data Access
- Data Analysis
- Data Products
- Publications
-
Links
Databases NED Simbad GCN circulars archive GRB data table Software & Tools Swift Software (HEASoft) Xanadu WebPIMMS Institutional Swift Sites GSFC PSU OAB SSDC MSSL University of Leicester
Pile-up - UPDATED 2022
Here, we present a step-by-step example for the determination of the pile-up level for the first snapshot of data obtained for GRB 091109A in PC mode. WT mode pile-up is discussed at the end of this thread, and cannot be performed in the same way as for PC.
Pile-up occurs when there is a significant probability that multiple photons registering within a given CCD frame will have overlapping charge distributions. This means that the resulting charge spatial distribution is recognised as a single event whose energy is the sum of the overlapping events (i.e., two or more soft X-ray photons can be registered as a single higher-energy photon), or a flux loss if the charge distribution has a grade outside that clasified as a true X-ray event (0-12 for PC mode; 0-2 for WT).
First, an image should be extracted for the period of interest. For a constantly bright source, all the data can be used together. If the source fades (or brightens), however, the user should identify a period of time when they believe pile-up may be present.
A quick way to estimate whether a section of data is piled-up or not is to extract a spectrum with a full circle centred on the source for a given time interval. If the count rate is ~0.5 count s-1 or above, the data should be checked for pile-up. As mentioned in the XSELECT thread, it is usually best to use the full grade selection (0-2 for WT; 0-12 for PC) for spectral analysis. Choose the same grade selection when determining the level of pile-up as you will use for subsequent analysis.
 >xselect
             **  XSELECT V2.2a  **

> Enter session name >[xsel]

xsel:ASCA >read event
> Enter the Event file dir >[./]
> Enter Event file list >[ ]
sw00375246000xpcw3po_cl.evt

Got new mission: SWIFT
> Reset the mission ? >[yes]

 Notes: XSELECT set up for      SWIFT

 Time keyword is TIME       in units of s

 Default timing binsize =   5.0000


Setting...
 Image  keywords   = X          Y           with binning =    1
 WMAP   keywords   = X          Y           with binning =    1
 Energy keyword   = PI                     with binning =    1


Getting Min and Max for Energy Column...
Got min and max for PI:     0   1023

Got the minimum time resolution of the read data:   2.5073
MJDREF =  5.1910000742870E+04 with TIMESYS = TT
 Number of files read in:            1

******************** Observation Catalogue ********************

Data Directory is: /home/work/kpa/2009/grb091109a/00375246000-xrt/
HK Directory is: /home/work/kpa/2009/grb091109a/003752460001-xrt/

        OBJECT      OBS_ID      DATE-OBS    DATAMODE
      1 Burst (309. 00375246000 2009-11-09T PHOTON

> filter region sw00375246000xpcw3po.reg
> extract curve
> filter time cursor
In this example, we are using the 20 pixel extraction region produced by the pipeline by including cleanup=no (see the xrtpipeline thread). The first snapshot of data has been selected using the filter time cursor command (see the main XSELECT thread).
> extract spectrum

extractor v5.11    11 May 2009
 Getting FITS WCS Keywords
 Doing file: /home/work/kpa/2009/grb091109a/00375246000-xrt/sw00375246000xpcw3po_cl.evt[regfilter("xsel_region.xsl",X,Y)]
100% completed

          Total      Good    Bad: Time     Phase     Grade       Cut
            627       354          273         0         0         0
================================================================================
    Grand Total      Good    Bad: Time     Phase     Grade       Cut
            627       354          273         0         0         0
   in  611.78     seconds

 Spectrum         has      354 counts for 0.5786     counts/sec
 ... written the PHA data Extension
This count rate is above the limit at which pile-up should be checked. Thus, the next step is to extract a full-frame image for this time and read it into XIMAGE to determine the level of pile-up.
> clear region
> extract image
> save image PC1
>$ximage
As explained in the XSELECT thread, tasks such as XIMAGE can be called from within XSELECT by prefacing the command with a dollar sign ($). Alternatively, the user can quit XSELECT and call XIMAGE directly from the command line.
> read PC1.img
> cpd /xtk
> disp
> back
 Calculating background: Poisson statistics assumed
 Background box size =  64
 Background =6.3569E-04 cts/original-pixel
            =6.3569E-04 cts/image-pixel
            =6.7586E-04 cts/sqarcmin/s
            =1.0433E-06 cts/original-pixel/s
Here, the image has been read in and plotted. The back command estimates the mean background over the entire image. Although this is not, strictly speaking, necessary, the next step sometimes fails if a good, full-field estimate of the background has not been determined. The other option is explicitly to state the background level if known (in terms of counts pixel-1).
The most accurate way to estimate the pile-up level is to zoom into the source and centre it in the image, to look something like this:
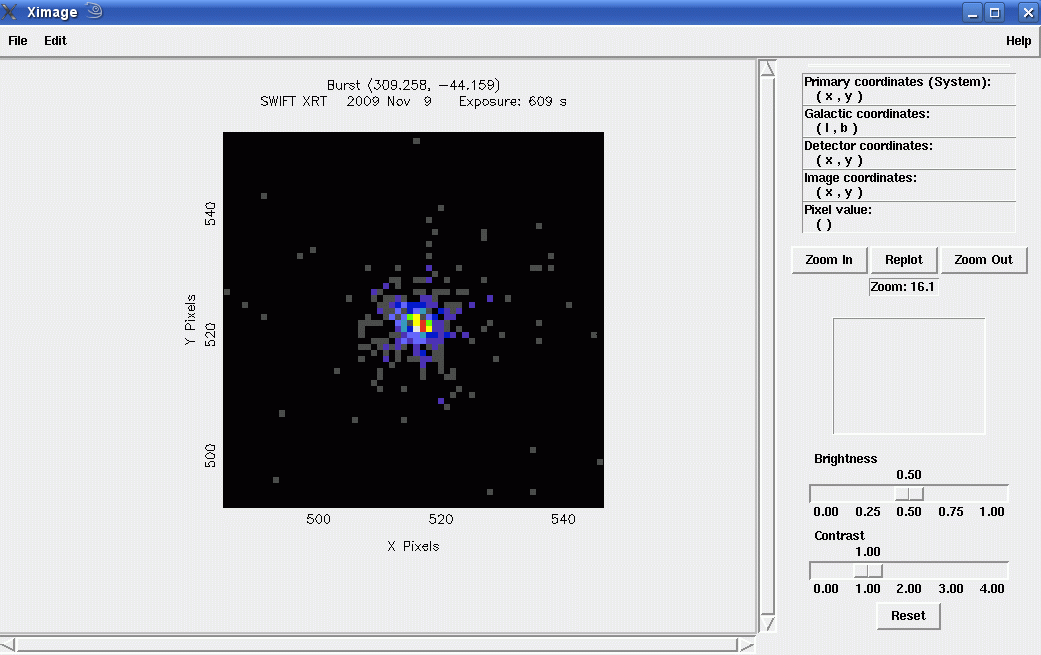
Then, using the command psf/cur, the user should click in the centre of the source and then again where the PSF fades into the background. For a typical point source, this will be between about 15 and 25 pixels (in either the X or Y direction - the programme averages in all directions) out from the centre; for very bright sources, this may be further out.
>psf/cur
 Select center
 Cursor is active

              Pixel coordinates

          X=   516.15    Y=   522.04
 Distance from optical axis: 27.32408333 pixels
 Select outer radius
 Cursor is active
              Pixel coordinates

          X=   513.70    Y=   506.01

 radius(arcmin) = 0.629747212
 BACK not specified
 calculating mean background from all image
 Using existing background calculation
 Background box size =  64
 Background =6.3569E-04 cts/original-pixel
            =6.3569E-04 cts/image-pixel
            =6.7586E-04 cts/sqarcmin/s
            =1.0433E-06 cts/original-pixel/s

  Using average energy for PSF:   1.00000000
 Total counts (original)      =       346.0
 Total counts (bg subtracted) =       345.5
 Total counts (psf corrected) =       396.5
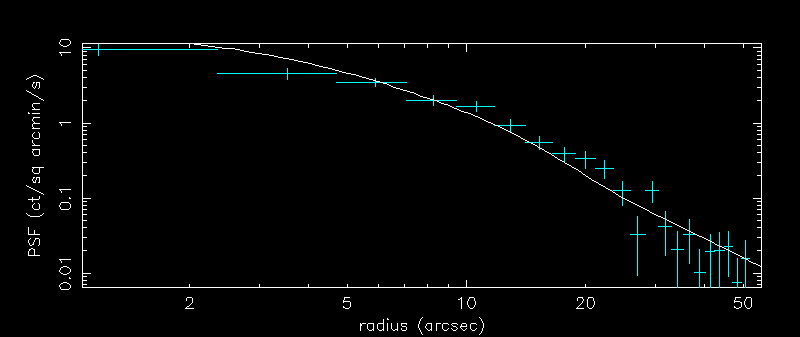
This will open an interactive plot window, with panels showing both the Encircled Energy Function and the PSF.
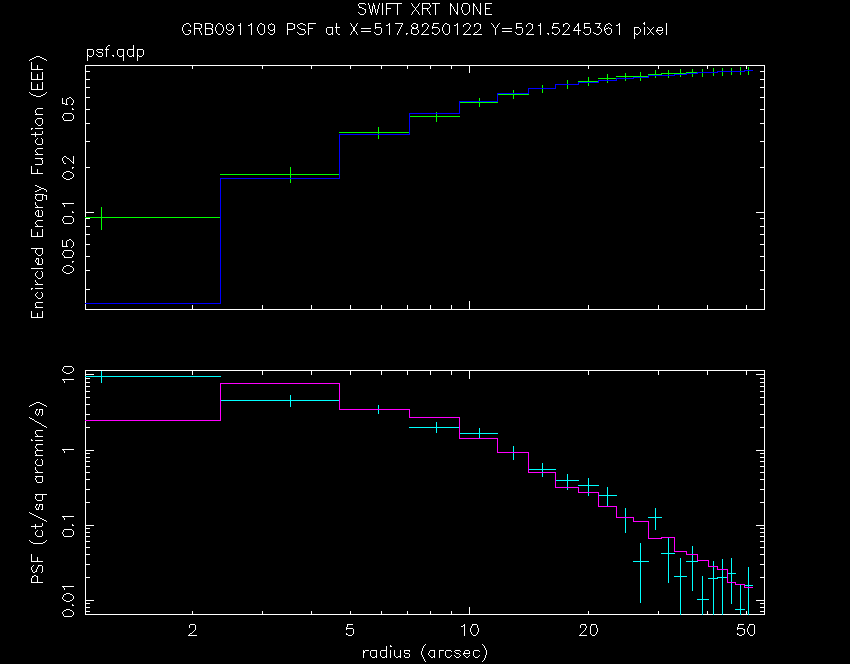
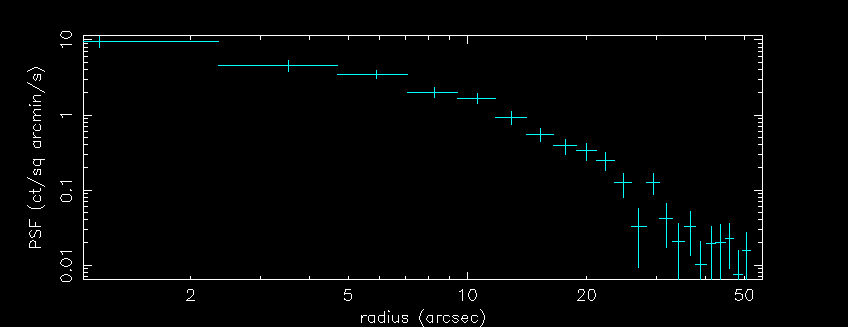
The cyan points in the PSF plot are the only ones of interest. Thus, the easiest way to avoid getting confused is to turn off the plotting of all the other datasets, as described here:
>col off 1 2 3 4 6
The updated XRT PSF is modelled by a combination of a King function and a Gaussian component:
PSF(r) = W exp[-r2/(2σ2)] + (1-W)[ 1 + (r/rc)2 ]-β
where, for the Swift PC mode, W ~ 0.075, σ ~ 7.42, rc ~ 3.72 and β ~ 1.31 (see PSF release note). The σ and rc values stated here are in arcsec, where 1 pixel = 2.357 arcsec; the release note gives them in pixels.
Pile-up affects the centre of the PSF such that too few counts will be seen with respect to the King function. Out in the wings, however, the King+Gaussian function will fit the data. In order to determine the point at which the data and model diverge, the PSF model should be fitted to the outer wings and then extrapolated to the inner region to compare with the data points. To simplify this, we provide a cod file of the PSF model, where the only variable is the normalisation. Depending on how bright the source is, at least 10-15 arcsec should be excluded from the fit initially:
>rescale x 15
>model psf.cod
 1 P1: VAL(  1.000    ), SIG(  0.000    ), PLO(  0.000    ), PHI(  0.000    )? 1
>fit
 Fitting group   5,  from   15.0     to   69.0
 Fitting      20 points in a band of      20.
   26.8267765
 ( -3)   W-VAR= 17.32
 ( -2)   W-VAR= 17.32
   42.6077003
This will fit the King+Gaussian function to the outermost data (beyond 15 arcsec: rescale x 15 ignores all the data within 15 arcsec; only the data range visible in the window is used to fit the model), producing a following plot:
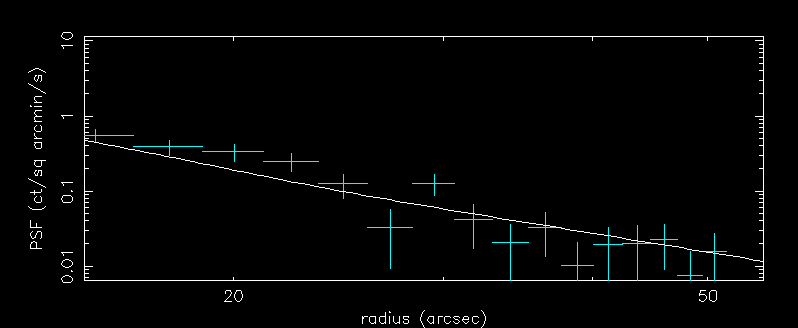
Now the model should be compared to the centre of the PSF, to determine the point at which it no longer fits the data. This is the radius which should be excluded when extracting spectra or light-curves in XSELECT. It may be useful to change the y-axis scaling as well, to be able to see the plot more clearly. rescale can be used with or without limits. fit plot 100 smooths the model line.
>rescale x
>rescale y 0.02 20
>fit plot 100
It may be easier to consider the plot in linear space, rather than log. To do this, type log off. Zooming in would give a plot something like this:
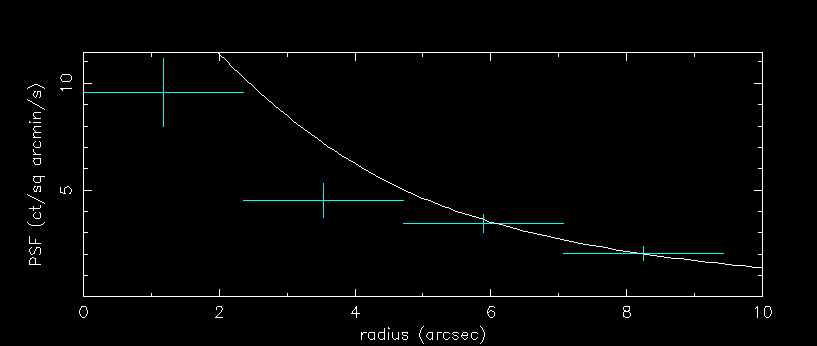
In the above plot, the model and data diverge below about 6 arcsec. Therefore, 2 or 3 pixels (1 pixel = 2.357 arcsec) should be excluded when extracting files in XSELECT. To do this, choose an annulus as the region shape from the menu at the top of the ds9 window, position the annulus in the field of view and double click to bring up the parameters box. Then type the relevant number of pixels into the inner and outer radius buttons (30 pixels is a suitable outer radius) and click generate (middle button at the bottom of the window), followed by apply (bottom left button).
Running xrtmkarf with the PSF correction set to yes will create an ARF corrected for the loss of counts caused by this annular exclusion.
Windowed Timing Mode
In general, WT mode data should not be affected by pile-up below intensities of about 100 count s-1. See the appendix of Romano et al. (2006) for more details. Methods for compensating when pile-up does occur are discussed below.
Please note that there are many ways to investigate the level of pile-up, and the details above are only an introduction. Other methods include:
- looking at the spectral distortion - Extract spectra
excluding different amounts of the core. If the source is piled-up, the
spectrum should be harder (i.e., Γ is a smaller number) than
expected. When increasing the inner annular region no longer alters the
photon index, the region affected by pile-up will have been excluded.
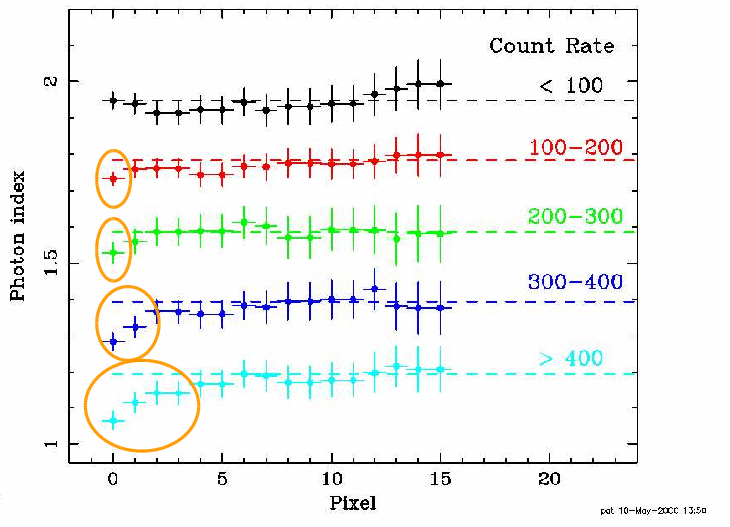
Using GRB 060124 as an example (see Romano et al. 2006), the plot above shows how the photon index changes as more core pixels are excluded from the extraction for a WT observation (the count rates for PC mode would, of course, be much lower). The orange ellipses indicate the points where pile-up is affecting the data. The spectra at different count rates have been shifted vertically for clarity.
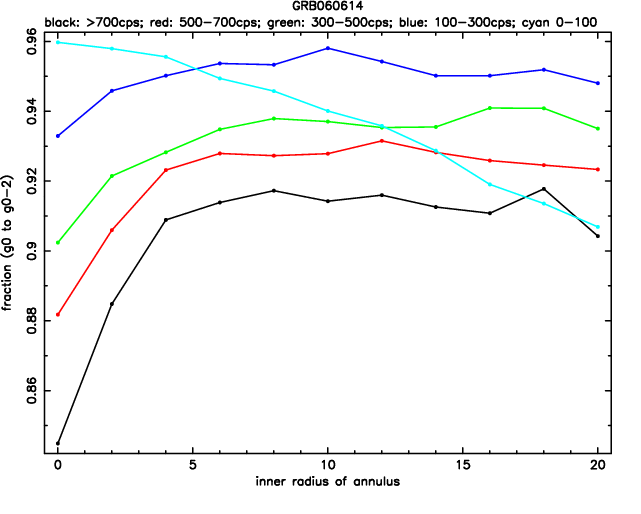
- investigating the grade distribution - Where pile-up
is a problem, fewer than expected single pixel (grade 0) events are
detected. Making plots of the fraction of grade 0 events against central
exclusion region can give an indication of the amount of core which should be
excluded.
For typical WT data, between about 100-300 count s-1, the fraction of grade 0 events stays close to constant, implying little pile-up. The decrease in grade 0 events for count rates below 100 count s-1 is likely to be due to the PSF being tighter at low (soft) energies. That is, grade 0 events are more likely to be found "closer in" to the centre of the PSF; thus, excluding any of the core will remove a larger fraction of grade 0 events than grade 0-2 ones (assuming there is no pile-up).
These methods are applicable to PC and WT data analysis. When extracting piled-up WT data, use either an annulus (as for the PC data; easiest method) or circle-circle. Do NOT use a box annulus; this will give incorrect results for the ARF) or a box-box region. Do be aware that the BACKSCAL keywords may need editing, depending on the interplay between the source and background regions.