- Home
- About
- Support
- Data Access
- Data Analysis
- Data Products
- Publications
-
Links
Databases NED Simbad GCN circulars archive GRB data table Software & Tools Swift Software (HEASoft) Xanadu WebPIMMS Institutional Swift Sites GSFC PSU OAB SSDC MSSL University of Leicester
2SXPS Catalogue: On-line Documentation
Search catalogue | Catalogue paper | Table descriptions | Download catalogue files | Upper limit server.
On this page:
Other documentation:
Summary / Quick-start information
| Data included | 2005 Jan 01 — 2018 August 01 | |
|---|---|---|
| Sky coverage | 3,790 square degrees | |
| Typical Sensitivity (0.3—10 keV) |
2×10-13 erg cm-2 s-1 (observations)
4×10-14 erg cm-2 s-1 (stacked images) | |
| Typical position error | 5.6′′ (90% confidence radius, including systematics) | |
| Detections | 1,091,058 | |
| Unique sources | 206,335 | |
| Variable sources | 82,324 | |
| Uncatalogued sources1 | 78,100 | |
| False positive rate | Flag=Good | 0.3% |
| Flag=Good/Reasonable | 1% | |
| Flag=Good/Reasonable/Poor | <10% | |
Table 1. Summary details of the 2SXPS catalogue.
1Sources counted as ‘Uncatalogued’ here may have matches USNO-B1, 2MASS or ALLWISE,
as the rate of spurious matches to those catalogues is very high.
The 2SXPS catalogue covers 3,790 square degrees on the sky and contains position, fluxes, spectral details and variability information for 206,335 X-ray point sources detected in observations with the Swift X-ray Telescope between 2005 Jan 01 and 2018 August 01. Each source has a detection flag which indicates how likely it is to be a real astrophysical object. Table 1 shows the false positive rate as a function of flag and other summary information.
Full details of how the catalogue was constructed are given in Evans et al (2020). The underlying process was similar to 1SXPS, however with several key improvements. Most noteworthy of these were better modelling of pile up, improved background modelling, especially in the presence of stray light, and a refined PSF. Additionally, larger stacked images were permitted than was possible in 1SXPS.
On this web page we give some summary details of the catalogue; how to access, use and cite it; a demonstration of its quality and performance; and finally details of the catalogue contents. Other pages provide details about the 2SXPS website and the upper-limit tool.
When Searching the catalogue you can select a pre-defined subset of the full catalogue to search, for greater purity (but reduced completeness). There are two such samples, as defined in Table 2.
| Sample | Sources | Datasets |
|---|---|---|
| All | All sources. | All datasets. |
| Clean | Sources with a detection flag of 0 or 1, a field flag of 0 or 1, and none of the ‘OpticalLoadingWarning,’ ‘StrayLightWarning’ and ‘NearBrightSourceWarning’ warnings set. | Datasets with a field flag of 0 or 1. |
| Ultra-clean | A subset of clean sources with detection and field flags of 0. | Datasets with detection flag of 0. |
Table 2. Definitions of the pre-defined subsets that can be selected.
Data Access and Usage
The catalogue can be queried through the search interface, or downloaded as a FITS file, CSV file or SQL dump.
Not all columns contain values for each entry in the tables,
for example, in the Sources table, only sources for which a spectral fit exists have entries in the
Fitted* fields. In the CSV files, such empty entries are literally empty; in the FITS and SQL
files these entries are NULL.
If you use data from this catalogue in your work, please cite Evans et al. (2020) and in the acknowledgements section of your publication, please state:
This work made use of data supplied by the UK Swift Science Data Centre at the University of Leicester.
Completeness and purity
In order to evaluate the performance of the 2SXPS source detection system we made use of an extensive set of simulations. This is described in detail in Section 7 of Evans et al. (2020). We simulated fields for a range of exposure times and background levels, chosen to reflect the range of such values in 2SXPS. Simulations did not include artifacts such as stray light, hot pixels, bright Earth or diffuse sources; however, our screening process is designed to identify and flag 2SXPS sources affected by such phenomena. We ran the 2SXPS source detection algorithm on the simulated images, and so by comparing the set of detected sources with the input list of simulated sources, we can measure both the completeness of our detection system and its purity.
Each detection is assigned a flag based on various statistical tests. These flags were calibrated (via the simulations) such that the fraction of spurious sources was 0.3% (i.e. equivalent to a Gaussian 3-σ significance) for Good, 1% when Good and Reasonable sources are considered, and up to 10% when the Poor sources are also included. Fig. 1 shows the false positive rate obtained from the simulations as a function of exposure time, validating the purity claims made here.
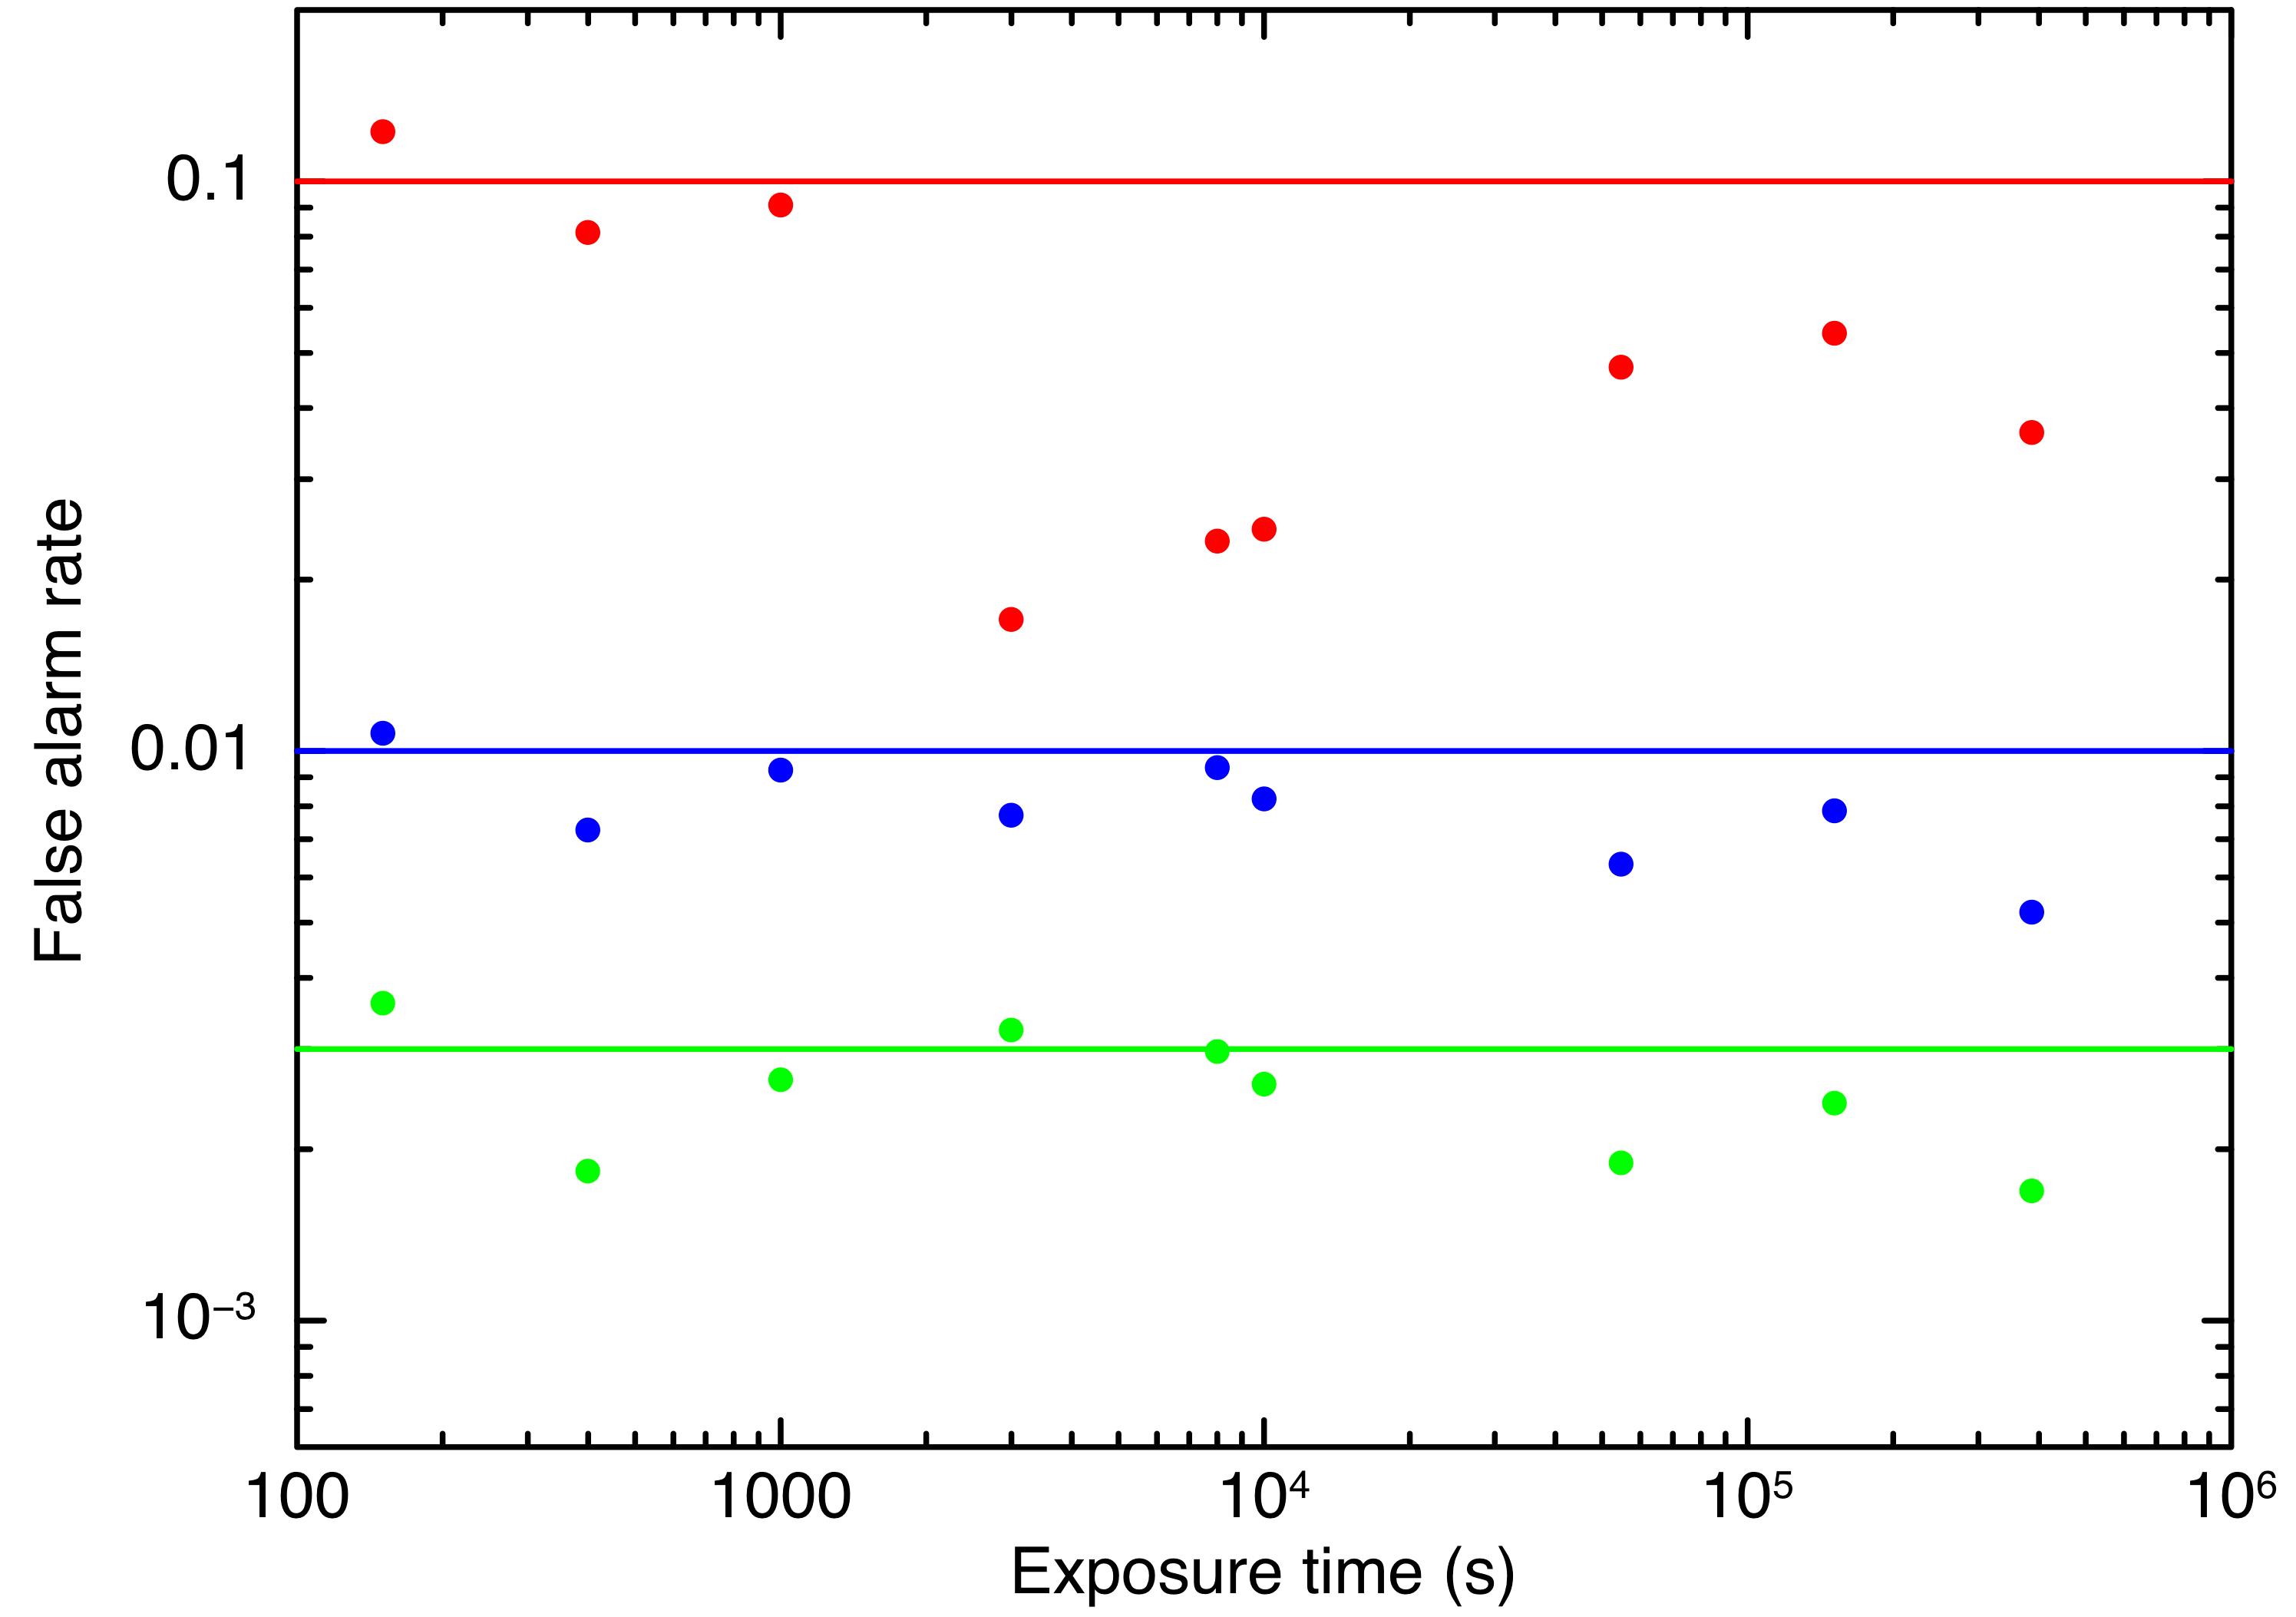
Fig. 1 False positive rate as a function of exposure time and flag. The green points refer to Good sources, blue points are Good and Reasonable and red shows all sources.
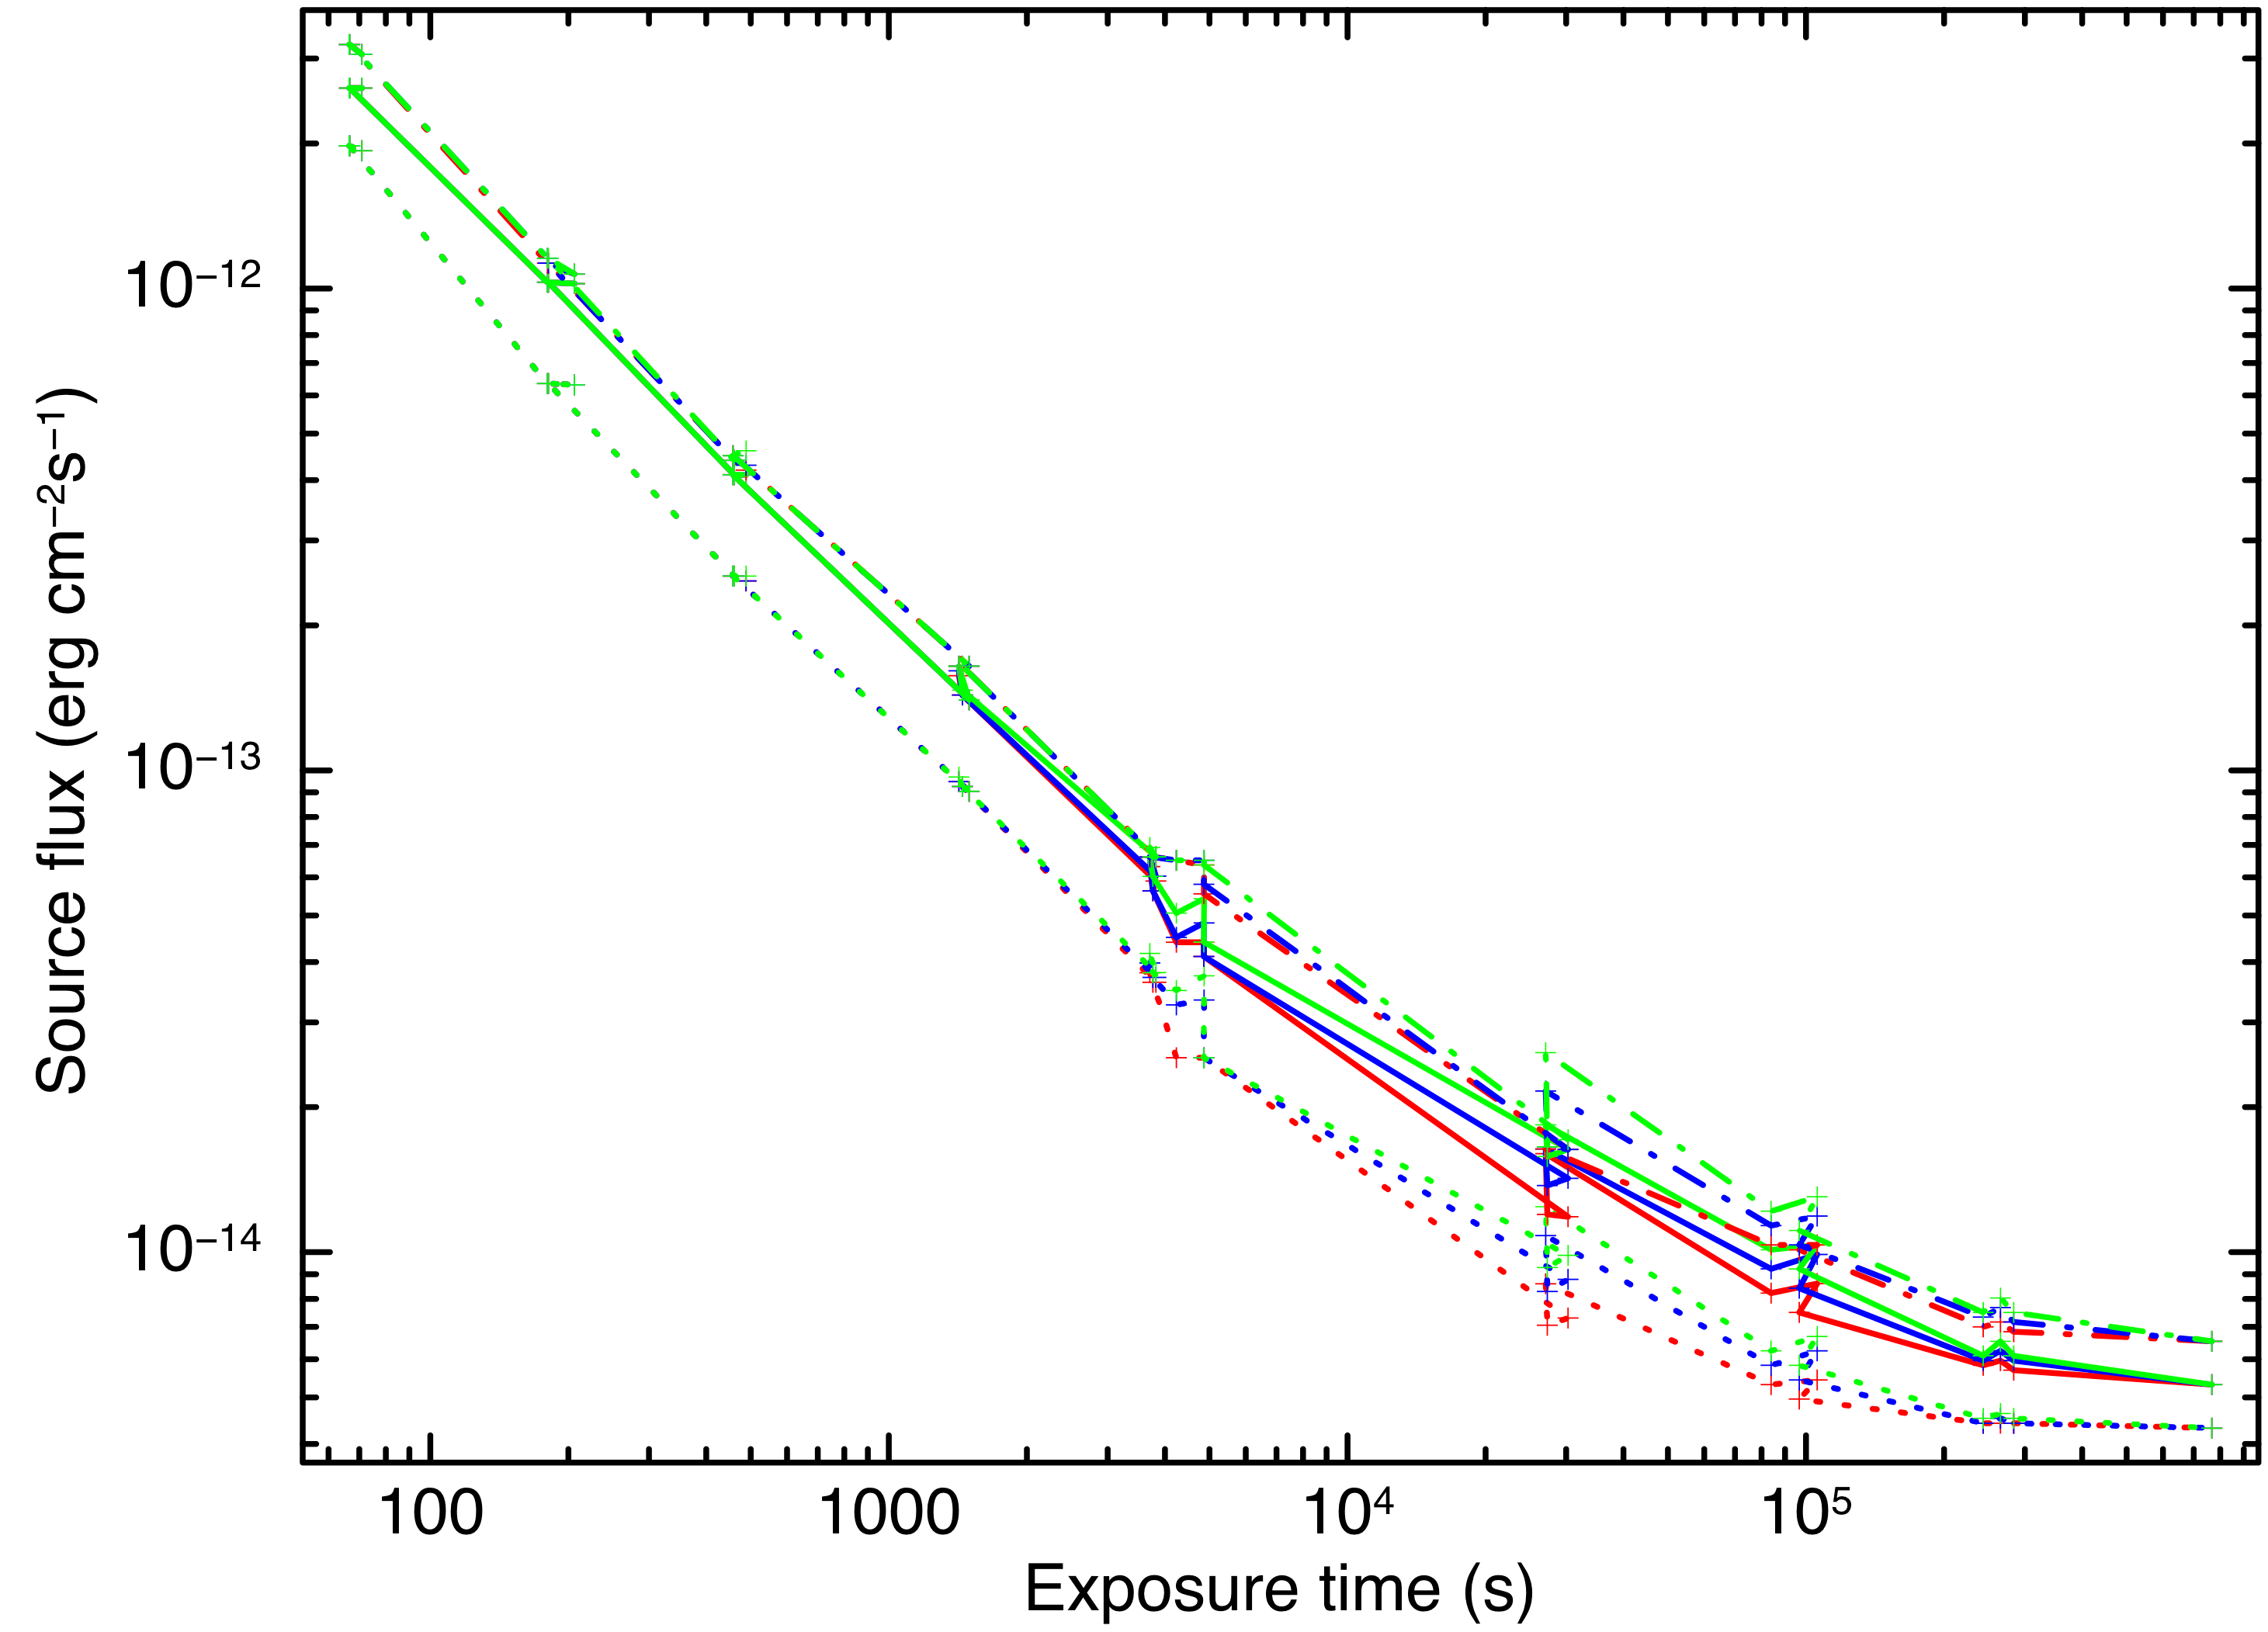
Fig. 2 The completeness of 2SXPS. The dotted, solid and dash-dot lines show the flux at which 10%, 50% and 90% of the simulated sources were recovered, respectively. Colours are as in Fig. 1.
Notes on terminology
There are various phrases and labels used within the 2SXPS catalogue which it is important users properly understand, especially since the meanings of these labels may differ from those used in other catalogues. Several key pairs of labels are described here.
Datasets: observations and stacked images (and snapshots)
Swift data are organised into observations, each of which has a unique 11-digit obsID. An observation generally contains all observations of a given location within a UT day, and may consist of multiple snapshots, taken on different spacecraft orbits, as described on this page. The basic datasets from which 2SXPS was created are the observations.
Many locations on the sky are observed repeatedly by Swift, for example, to monitor the evolution of a specific source, and so we also combined overlapping observations to give a single dataset of greater exposure, allowing fainter sources to be detected. We call these datasets stacked images. Some observations have only partial overlap, and one can make long ‘chains’ of overlapping observations covering large spatial areas. We defined a maximum stacked image size of 2,300 pixels (~90′) to a side and then created stacked images such that every overlap of observations is in at least one stack. Thus, multiple stacked images can overlap, and an observation can contribute to multiple stacked images; but the maximum exposure at any given sky is reached for every location Swift has observed.
Within each dataset (observation or stacked image), source detection and PSF fitting is carried out on each of the four bands independently of each other. Note that this is not the same approach as the XMM catalogues, in which the energy bands are handled simultaneously.
There is a third natural timescale to consider for Swift data. The satellite is in a low-Earth orbit and due to its Earth-limb avoidance constraints, the longest window of continuous visibility for any point on the sky is around 2.7 ks. Thus if an observation is required which is longer than this (or in which multiple exposures are desired within a UT day, for science reasons) the observation will comprise a number of separate exposures, known as ‘snapshots’. Each snapshot is a continuous exposure in a single pointing direction. We do not carry out source datection on individual snapshots, however light curves are built with per-snapshot binning (as well as per-observation binning) and variability calculations are also carried out on this timescale.
Detections and sources; and aliases
In the creation of 2SXPS source detection was carried out on every dataset, and every energy band independently (as noted above, this differs from the XMM approach). Thus for many sources there are multiple detections, in the different energy bands and in different datasets covering the source location. Details of these are all listed in the ‘Detections’ table available for download, and are given in the relevant parts of the different web pages.
These separate detections were then rationalised into a single list of unique source in two steps. First, detections across different bands but within the same dataset were combined. For this stage, only the statistical errors on the source positions, as deduced from the PSF fit, were used to determine whether two detections corresponded to the same underlying source. This is because, since all detections at this point are from the same dataset, the astrometric system is the same for all sources and so its uncertainty is irrelevant. Then the lists of unique soures per dataset were combined to create the final source list; at this stage the astrometric uncertainty associated with the datasets was taken into account.
The process of merging detections was not perfect. Occasionally the statistical uncertainties were underestimated and also the astrometric uncertainty appears to have a broad tail. As a result of this a small number of sources exist for which multiple detections were not correctly merged, and instead the catalogue contains two distinct sources which really are the same object. Based on an inspection of the distribution of source separations in the catalogue, we therefore identified any sources which lie within 20″ of each other and are not detected in the same dataset, and labelled these as possible aliases of each other. It is vital to note that not everything so labelled is really an alias; in some cases they are genuinely distinct sources which are close together. In other cases, particularly where one of the sources is very bright; the nearby sources are spurious detections in the PSF wings; this is not the same as an alias. In the case of genuine aliases, the available light curves of the sources will be incomplete and incorrect. That is, if a source is incorrectly identified as being two sources, called source A and source B, then the light curve of source A will not contain values derived from the blind detections that were assigned to source B, and furthermore the bins from those datasets where the source was called source B will have been deduced (for source A) based on the background map with the PSF model of source B present! Therefore, in the light curve section of the source pages, an option is given to consolidate across aliases of the source. Using this you can select which sources are genuine aliases, and the correct light curve will then be produced.
Blind and non-blind (retrospective) detections
The sources present in 2SXPS were detected via a blind search. That is, no a-priori knowledge of the possible existence of sources was used to deduce whether or not a given set of photons corresponded to the detection of a point source. However, once the list of sources had been produced, a retrospective check was carried out on those datasets in which the source was located, but had not been detected by the blind search. In this case the existence of a source at the specific location was assumed a-priori, and the count-rate of the source inferred based on the number of source and background events at the source's location. If this count-rate was above zero, with 99.7% confidence (i.e 3-σ), the source was deemed to have been present and thus detected in that dataset. The detections database table only lists the blind detections; sources identified as detected in this non-blind, retrospective analysis were not added to the table, however in the light curve analysis they are marked as being detected in those datasets. When viewing the light curves you have the option of whether non-detections should be shown as 3-σ upper limits, or datapoints with 1-σ error-bars, and you can specify this separately for bins in which the source was not detected in any way, and those in which there was no blind detetion, but in which the targeted analysis yields a non-zero count rate.
Catalogue Contents
There are four tables available for download:
- Sources
- This is the main catalogue table. This contains the details of the unique sources in the catalogue.
- Datasets
- This contains details of the individual datasets (observations and stacked images) of which the catalogue is composed.
- Detections
- This contains details of the individual detections in each dataset and energy band, of the sources.
- Cross correlations
- This contains details of sources from external catalogues which are positionally coincident with 2SXPS sources.
Sources Table
The Sources table is the main catalogue table, and gives details of each unique source identified in the catalogue. There are 230 columns in this table in total, so for ease of consideration we have grouped them into the following categories:
- Identifiers (2 column)
- Position information (10 columns)
- Exposure information (21 columns)
- Flag information (11 columns)
- Count-rate information (46 columns)
- Variability information (12 columns)
- Spectral/Flux information (112 columns)
- Cross-correlation information (16 columns)
Identifiers
There are 2 columns in this group. Show.
- 2SXPS ID
- A unique numerical identifier for this source.
- Name
- The unique IAU format unique source name, of the form:
2SXPS JHHMMSS.S+ddmmss
[Hide identifier columns | Back to Sources table | Back to top | 2SXPS index]
Position information
There are 9 columns in this group. Show.
- RA
- The Right Ascension (J2000) of the source, taken from the individual detection with the highest S/N and best detection flag.
- Decl
- The declination (J2000) of the source, taken from the individual detection with the highest S/N and best detection flag.
- Err90
- The 90% confidence radial position error on the source position, taken from the same individual detection as the position. This includes the astrometric systematic error.
- AstromType
- This relates the provenance of the astrometry used to derive the source position.
- 0: Astrometry from the Swift star trackers.
- 1: Astrometry from rectification with 2MASS.
- l
- The Galactic longitude in degrees of the best position of the source.
- b
- The Galactic latitude in degrees of the best position of the source.
- MeanOffAxisAngle
- The mean distance angle (in arc minutes) of the source from the centre of the XRT detector averaged over all observations in which the source was detected and inside the XRT field of view. There is a handful of sources for which this value is -1. This indicates that the source centre was never in the field of view, that is, the detection and centroid was based on the wings of the PSF that extended into the field of view while the source itself was outside.
- OrigErr90
- In the initial release of 2SXPS the statsitical component of the error was a factor of 1.5 too large, due to an error in the conversion from 1-σ to 90% confidence. This has now been corrected, however the value originally released (and used in cross correlation) is given in this field.
- NearestNeighbour
- The distance to the nearest 2SXPS source to this one, in arcsec.
- NearestOKNeighbour
- The distance to the nearest 2SXPS source to this one, with a flag of 0 or 1, i.e. Good or Reasonable with no other warning bit set; in arcsec.
[Hide position columns | Back to Sources table | Back to top | 2SXPS index]
Exposure information
There are 21 columns in this group. Show.
- Exposure
- The total exposure at the location of the source in seconds, including datasets in which the source was not detected.
- FirstObsDate
- The UTC date and time of the start of the first observation in 2SXPS which covered the location of the source.
- LastObsDate
- The UTC date and time of the end of the last observation in 2SXPS which covered the location of the source.
- FirstObsMET
- The time of the start of the first observation in 2SXPS which covered the location of the source, in Swift MET.
- LastObsMET
- The time of the end of the last observation in 2SXPS which covered the location of the source, in Swift MET.
- FirstDetDate
- The UTC date and time of the start of the first observation in 2SXPS in which the source count-rate in any band is inconsistent with 0 at the 3-σ level; i.e. the first observation in which the source was detected by the blind search or retrospective count-rate determination.
- LastDetDate
- The UTC date and time of the end of the last observation in 2SXPS in which the source count-rate in any band is inconsistent with 0 at the 3-σ level; i.e. the first observation in which the source was detected by the blind search or retrospective count-rate determination.
- FirstDetMET
- The time, in Swift MET, of the start of the first observation in 2SXPS in which the source count-rate in any band is inconsistent with 0 at the 3-σ level; i.e. the first observation in which the source was detected by the blind search or retrospective count-rate determination.
- LastDetMET
- The time, in Swift MET, of the end of the last observation in 2SXPS in which the source count-rate in any band is inconsistent with 0 at the 3-σ level; i.e. the first observation in which the source was detected by the blind search or retrospective count-rate determination.
- FirstBlindDetDate
- The UTC date and time of the start of the first observation in 2SXPS in which the source was detected in the blind search.
- LastBlindDetDate
- The UTC date and time of the end of the last observation in 2SXPS in in which the source was detected in the blind search.
- FirstBlindDetMET
- The time, in Swift MET, of the start of the first observation in 2SXPS in which the source was detected in the blind search.
- LastBlindDetMET
- The time, in Swift MET, of the end of the last observation in 2SXPS in which the source was detected in the blind search.
- NumObs
- The total number of datasets (observations+stacked images) which cover the location of the source, including those in which the source was not detected.
- NumBlindDetObs
- The number of datasets (observations+stacked images) in which the source was detected in the blind search.
- NumDetObs
- The number of datasets (observations+stacked images) in which the source was detected with the retrospective analysis.
- BestDetectionID
- The ID value from the detections table corresponding to the detection of this source for which the position and error have been taken.
- NonBlindDet_band0
- Whether the mean count-rate in the total (0.3—10 keV) is non-zero with 3-σ significance.
- NonBlindDet_band1
- Whether the mean count-rate in the soft (0.3—1 keV) is non-zero with 3-σ significance.
- NonBlindDet_band2
- Whether the mean count-rate in the medium (1—2 keV) is non-zero with 3-σ significance.
- NonBlindDet_band3
- Whether the mean count-rate in the hard (3—10 keV) is non-zero with 3-σ significance.
[Hide exposure columns | Back to Sources table | Back to top | 2SXPS index]
Flag information
There are 11 columns in this group. Show.
- DetFlag
- The best detection flag from all detections of the source.
The basic values are 0, 1, or 2, meaning Good, Reasonable or Poor respectively.
Higher values mean that an extra warning is associated with the source.
This warning is bitwise, defined as follows:
Bit Value Description 2 4 The source position is consistent with that of a known extended source. 3 8 The source is likely an alias of a badly-fitted piled up source. 4 16 The source lies in a region marked as contaminated during the visual screening. - Fieldflag
- The best field flag from all detections of the source. This is a bitwise flag with the following values:
Bit Value Description 0 1 Field contains stray light. 1 2 Field contains diffuse emission or artifacts. 2 4 Field contains stray light that could not be adequately modelled. 3 8 Field contains a bright, piled up source which was not properly fitted in some bands. 5 32 Screening of artifacts may contain an error. See explanation. - DetFlag_band0
- The best total-band (0.3—10 keV) detection flag from all detections of the source.
- DetFlag_band1
- The best soft-band (0.3—1 keV) detection flag from all detections of the source.
- DetFlag_band2
- The best medium-band (1—2 keV) detection flag from all detections of the source.
- DetFlag_band3
- The best hard-band (2—10 keV) detection flag from all detections of the source.
- OpticalLoadingWarning
- This is the worst optical loading warning from any detection of the source. If an optical source exists near the 2SXPS source, and is bright enough to cause optical loading then this field indicates how many magnitudes brighter than the optical loading limit that source is, otherwise it is zero.
- StrayLightWarning
- This is set to one if any detections of the source occurred in a region affected by stray light, otherwise zero.
- NearBrightSourceWarning
- Whether any detection of this source occurred where the background level exceeded 10-3 ct s-1 pixel-1, i.e. was likely in the wings of a bright source. A value of zero indicates this did not occur. A value of one indicates that it did. A value of two means that the source was detected in a stacked image in which the background was not high (averaged over the whole stacked exposure), but where there was at least one observation in which the source was undetected, and the background at the source position was in excess of 10-3 ct s-1 pixel-1.
[Hide flag columns | Back to Sources table | Back to top | 2SXPS index]
Count-rate information
There are 46 columns in this group. Show.
- Rate_band0
- The time-averaged total-band (0.3—10 keV) count-rate of the source, in counts per second.
- Rate_band0_pos
- The 1-σ positive error on the time-averaged total-band (0.3—10 keV) count-rate of the source. If more than 100 net counts (i.e. after background subtraction) were detected, or the number of counts in the source or background exceeded 1000, this is the Poisson error, otherwise it is calculated from the Bayesian method of Kraft, Burrows & Nousek (1991).
- Rate_band0_neg
- The 1-σ negative error on the time-averaged total-band (0.3—10 keV) count-rate of the source. If more than 100 net counts (i.e. after background subtraction) were detected, or the number of counts in the source or background exceeded 1000, this is the Poisson error, otherwise it is calculated from the Bayesian method of Kraft, Burrows & Nousek (1991).
- HR1
- The HR1 hardness ratio = (M-S)/(M+S) where M and S are the medium (1—2 keV) and soft (0.3—1 keV) band count-rates. If both bands had more than 100 photons and an S/N ratio of at least 2 this was calculated simply from this equation, otherwise the Bayesian approach of Park et al. (2006) was employed.
- HR1_pos
- The 1-σ positive error on HR1. In a small number of cases where the Bayesian approach of Park et al. (2006) was used to derive HR1, the mean HR value lay outside the 1-σ confidence interval. In these cases the HR1_pos error may be negative.
- HR1_neg
- The 1-σ negative error on HR1. In a small number of cases where the Bayesian approach of Park et al. (2006) was used to derive HR1, the mean HR value lay outside the 1-σ confidence interval. In these cases the HR1_neg error may be positive.
- HR2
- The HR2 hardness ratio = (H-M)/(H+M) where H and M are the hard (2—10 keV) and medium (1—2 keV) band count-rates. If both bands had more than 100 photons and an SNR of at least 2 this was calculated simply from this equation, otherwise the Bayesian approach of Park et al. (2006) was employed.
- HR2_pos
- The 1-σ positive error on HR2. In a small number of cases where the Bayesian approach of Park et al. (2006) was used to derive HR2, the mean HR value lay outside the 1-σ confidence interval. In these cases the HR2_pos error may be negative.
- HR2_neg
- The 1-σ negative error on HR2. In a small number of cases where the Bayesian approach of Park et al. (2006) was used to derive HR2, the mean HR value lay outside the 1-σ confidence interval. In these cases the HR2_neg error may be positive.
- Rate_band1
- The time-averaged soft-band (0.3—1 keV) count-rate of the source, in counts per second.
- Rate_band1_pos
- The 1-σ positive error on the time-averaged soft-band (0.3—1 keV) count-rate of the source.
- Rate_band1_neg
- The 1-σ negative error on the time-averaged soft-band (0.3—1 keV) count-rate of the source.
- Rate_band2
- The time-averaged medium-band (1—2 keV) count-rate of the source, in counts per second.
- Rate_band2_pos
- The 1-σ positive error on the time-averaged medium-band (1—2 keV) count-rate of the source.
- Rate_band2_neg
- The 1-σ negative error on the time-averaged medium-band (1—2 keV) count-rate of the source.
- Rate_band3
- The time-averaged hard-band (2—10 keV) count-rate of the source, in counts per second.
- Rate_band3_pos
- The 1-σ positive error on the time-averaged hard-band (2—10 keV) count-rate of the source.
- Rate_band3_neg
- The 1-σ negative error on the time-averaged hard-band (2—10 keV) count-rate of the source.
- Counts_band0
- The total number of events (not background subtracted or exposure corrected) in the total-band (0.3—10 keV) image, in the source extraction region for this source. This is found by summing the counts in the individual observations of the location, not from the stacked image.
- Counts_band1
- The total number of events (not background subtracted or exposure corrected) in the soft-band (0.3—1 keV) image, in the source extraction region for this source.
- Counts_band2
- The total number of events (not background subtracted or exposure corrected) in the medium-band (1—2 keV) image, in the source extraction region for this source.
- Counts_band3
- The total number of events (not background subtracted or exposure corrected) in the hard-band (2—10 keV) image, in the source extraction region for this source.
- BGCounts_band0
- The sum of the background map in the total-band (0.3—10 keV) source extraction region for this source. This is found by summing the maps in the individual observations of the location, not from the stacked image.
- BGCounts_band1
- The sum of the background map in the soft-band (0.3—1 keV) image, in the source extraction region for this source.
- BGCounts_band2
- The sum of the background map in the medium-band (1—2 keV) image, in the source extraction region for this source.
- BGCounts_band3
- The sum of the background map in the hard-band (2—10 keV) image, in the source extraction region for this source.
- RateCF_band0
- The count-rate correction factor in the total band (0.3—10 keV). This corrects for vignetting, bad columns, pile-up and the finite radius within which counts were extracted.
- RateCF_band1
- The count-rate correction factor in the soft band (0.3—1 keV).
- RateCF_band2
- The count-rate correction factor in the medium band (1—2 keV).
- RateCF_band3
- The count-rate correction factor in the hard band (2—10 keV).
- UL_band0
- The overall 3-σ upper limit on the total-band (0.3—10 keV) count-rate from the source, derived from the
Counts_band0,BGCounts_band0,RateCF_band0andExposurecolumns. If more than 100 net counts (i.e. after background subtraction) were detected, or the number of counts in the source or background exceeded 1000, this was determined using Poisson errors, otherwise it is calculated from the Bayesian method of Kraft, Burrows & Nousek (1991). Note that this upper limit value is supplied for all sources, regardless of the strength of the detection. - UL_band1
- The overall 3-σ upper limit on the soft-band (0.3—1 keV) count-rate from the source.
- UL_band2
- The overall 3-σ upper limit on the medium-band (1—2 keV) count-rate from the source.
- UL_band3
- The overall 3-σ upper limit on the hard-band (2—10 keV) count-rate from the source.
- PeakRate_band0
- The peak count-rate of the source in the total band (0.3—10 keV). The peak rate is defined as the count-rate in the light curve bin (from per-snapshot or per-obsid binning) with the highest 1-σ lower limit.
- PeakRate_band0_pos
- The 1-σ positive error on the peak total-band (0.3—10 keV) count-rate of the source.
- PeakRate_band0_neg
- The 1-σ negative error on the peak total-band (0.3—10 keV) count-rate of the source.
- PeakRate_band1
- The peak count-rate of the source in the soft band (0.3—1 keV).
- PeakRate_band1_pos
- The 1-σ positive error on the peak total-band (0.3—1 keV) count-rate of the source.
- PeakRate_band1_neg
- The 1-σ negative error on the peak total-band (0.3—1 keV) count-rate of the source.
- PeakRate_band2
- The peak count-rate of the source in the soft band (1—2 keV).
- PeakRate_band2_pos
- The 1-σ positive error on the peak total-band (1—2 keV) count-rate of the source.
- PeakRate_band2_neg
- The 1-σ negative error on the peak total-band (1—3 keV) count-rate of the source.
- PeakRate_band3
- The peak count-rate of the source in the soft band (2—10 keV).
- PeakRate_band3_pos
- The 1-σ positive error on the peak total-band (2—10 keV) count-rate of the source.
- PeakRate_band3_neg
- The 1-σ negative error on the peak total-band (2—10 keV) count-rate of the source.
[Hide count-rate columns | Back to Sources table | Back to top | 2SXPS index]
Variability information
There are 12 columns in this group. Show.
- PvarPchiSnapshot_band0
- The probability that the source is constant between snapshots in the total band (0.3—10 keV), as derived from the Pearson's χ2 test. The minimum recordable value for this is 1.1×10⁻¹⁶ so values of 0 mean <1.1×10⁻¹⁶.
- PvarPchiSnapshot_band1
- The probability that the source is constant between snapshots in the soft band (0.3—1 keV), as derived from the Pearson's χ2 test.
- PvarPchiSnapshot_band2
- The probability that the source is constant between snapshots in the medium band (1—2 keV), as derived from the Pearson's χ2 test.
- PvarPchiSnapshot_band3
- The probability that the source is constant between snapshots in the hard band (2—10 keV), as derived from the Pearson's χ2 test.
- PvarPchiSnapshot_HR1
- The probability that the source HR1 hardness ratio is constant between snapshots, as derived from the Pearson's χ2 test.
- PvarPchiSnapshot_HR2
- The probability that the source HR2 hardness ratio is constant between snapshots, as derived from the Pearson's χ2 test.
- PvarPchiObsID_band0
- The probability that the source is constant between observations in the total band (0.3—10 keV), as derived from the Pearson's χ2 test.
- PvarPchiObsID_band1
- The probability that the source is constant between observations in the soft band (0.3—1 keV), as derived from the Pearson's χ2 test.
- PvarPchiObsID_band2
- The probability that the source is constant between observations in the medium band (1—2 keV), as derived from the Pearson's χ2 test.
- PvarPchiObsID_band3
- The probability that the source is constant between observations in the hard band (2—10 keV), as derived from the Pearson's χ2 test.
- PvarPchiObsID_HR1
- The probability that the source HR1 hardness ratio is constant between observations, as derived from the Pearson's χ2 test.
- PvarPchiObsID_HR2
- The probability that the source HR2 hardness ratio is constant between observations, as derived from the Pearson's χ2 test.
[Hide variability columns | Back to Sources table | Back to top | 2SXPS index]
Spectral/Flux information
There are 112 columns in this group. Show.
- GalacticNH
- The Galactic absorption column density (in cm-2) in the direction of the source, determined from Willingale et al. (2013).
- WhichPow
- Which of the available estimates of the power-law spectral ECF and fluxes is given in the summary fields:
Value Source of spectral information 0 Fixed spectrum: power-law with Γ=1.7 and NH is GalacticNH.1 Power-law spectral values derived from the hardness ratios. 2 Power-law spectral values taken from a fit to a custom-built spectrum. - WhichAPEC
- Which of the available estimates of the APEC spectral ECF and fluxes is given in the summary fields:
Value Source of spectral information 0 Fixed spectrum: APEC with kT=1 keV and NH is GalacticNH.1 APEC spectral values derived from the hardness ratios. 2 APEC spectral values taken from a fit to a custom-built spectrum. - PowECFO
- The counts-to-observed-flux (0.3—10 keV) conversion factor (in erg cm-2 ct-1)
derived from the power-law spectrum indicated by the
WhichPowfield. - PowECFU
- The counts-to-unabsorbed-flux (0.3—10 keV) conversion factor (in erg cm-2 ct-1)
derived from the power-law spectrum indicated by the
WhichPowfield. - PowFlux
- The observed 0.3—10 keV flux (in erg cm-2 s-1) derived from the power-law spectrum indicated by the
WhichPowfield. This is given byRate_band0*PowECFO. - PowFlux_pos
- The 1-σ positive error on the observed 0.3—10 keV flux for the power-law spectrum indicated by the
WhichPowfield. This is given byRate_band0_pos*PowECFO, so does not include uncertainties in the spectral modelling. - PowFlux_neg
- The 1-σ negative error on the observed 0.3—10 keV flux for the power-law spectrum indicated by the
WhichPowfield. This is given byRate_band0_neg*PowECFO, so does not include uncertainties in the spectral modelling. - PowUnabsFlux
- The unabsorbed 0.3—10 keV flux (in erg cm-2 s-1), derived from the power-law spectrum indicated by the
WhichPowfield. This is given byRate_band0*PowECFU. - PowUnabsFlux_pos
- The 1-σ positive error on the unabsorbed 0.3—10 keV flux for the power-law spectrum indicated by the
WhichPowfield. This is given byRate_band0_pos*PowECFU, so does not include uncertainties in the spectral modelling. - PowUnabsFlux_neg
- The 1-σ negative error on the unabsorbed 0.3—10 keV flux for the power-law spectrum indicated by the
WhichPowfield. This is given byRate_band0_neg*PowECFU, so does not include uncertainties in the spectral modelling. - APECECFO
- The counts-to-observed-flux (0.3—10 keV) conversion factor (in erg cm-2 ct-1)
derived the APEC spectrum indicated by the
WhichAPECfield. - APECECFU
- The counts-to-unabsorbed-flux (0.3—10 keV) conversion factor (in erg cm-2 ct-1)
derived from the APEC spectrum indicated by the
WhichAPECfield. - APECFlux
- The observed 0.3—10 keV flux (in erg cm-2 s-1) derived from the APEC spectrum indicated by the
WhichAPECfield. This is given byRate_band0*APECECFO. - APECFlux_pos
- The 1-σ positive error on the observed 0.3—10 keV flux for the APEC spectrum indicated by the
WhichAPECfield. This is given byRate_band0_pos*APECECFO, so does not include uncertainties in the spectral modelling. - APECFlux_neg
- The 1-σ negative error on the observed 0.3—10 keV flux for the APEC spectrum indicated by the
WhichAPECfield. This is given byRate_band0_neg*APECECFO, so does not include uncertainties in the spectral modelling. - APECUnabsFlux
- The unabsorbed 0.3—10 keV flux (in erg cm-2 s-1), derived from the APEC spectrum indicated by the
WhichAPECfield. This is given byRate_band0*APECECFU. - APECUnabsFlux_pos
- The 1-σ positive error on the unabsorbed 0.3—10 keV flux for the APEC spectrum indicated by the
WhichAPECfield. This is given byRate_band0_pos*APECECFU, so does not include uncertainties in the spectral modelling. - APECUnabsFlux_neg
- The 1-σ negative error on the unabsorbed 0.3—10 keV flux for the APEC spectrum indicated by the
WhichAPECfield. This is given byRate_band0_neg*APECECFU, so does not include uncertainties in the spectral modelling. - PowPeakFlux
- The peak observed 0.3—10 keV flux (in erg cm-2 s-1) for the power-law spectrum indicated by the
WhichPowfield. This is given byPeakRate_band0*PowECFO. - PowPeakFlux_pos
- The 1-σ positive error on the peak observed 0.3—10 keV flux for the power-law spectrum indicated by the
WhichPowfield. This is given byPeakRate_band0_pos*PowECFO, so does not include uncertainties in the spectral modelling. - PowPeakFlux_neg
- The 1-σ negative error on the peak observed 0.3—10 keV flux for the power-law spectrum indicated by the
WhichPowfield. This is given byPeakRate_band0_neg*PowECFO, so does not include uncertainties in the spectral modelling. - PowPeakUnabsFlux
- The peak unabsorbed 0.3—10 keV flux (in erg cm-2 s-1) for the power-law spectrum indicated by the
WhichPowfield. This is given byPeakRate_band0*PowECFU. - PowPeakUnabsFlux_pos
- The 1-σ positive error on the peak unabsorbed 0.3—10 keV flux for the power-law spectrum indicated by the
WhichPowfield. This is given byPeakRate_band0_pos*PowECFU, so does not include uncertainties in the spectral modelling. - PowPeakUnabsFlux_neg
- The 1-σ negative error on the peak unabsorbed 0.3—10 keV flux for the power-law spectrum indicated by the
WhichPowfield. This is given byPeakRate_band0_neg*PowECFU, so does not include uncertainties in the spectral modelling. - APECPeakFlux
- The peak observed 0.3—10 keV flux (in erg cm-2 s-1) for the APEC spectrum indicated by the
WhichAPECfield. This is given byPeakRate_band0*APECECFO. - APECPeakFlux_pos
- The 1-σ positive error on the peak observed 0.3—10 keV flux for the APEC spectrum indicated by the
WhichAPECfield. This is given byPeakRate_band0_pos*APECECFO, so does not include uncertainties in the spectral modelling. - APECPeakFlux_neg
- The 1-σ negative error on the peak observed 0.3—10 keV flux for the APEC spectrum indicated by the
WhichAPECfield. This is given byPeakRate_band0_neg*APECECFO, so does not include uncertainties in the spectral modelling. - APECPeakUnabsFlux
- The peak unabsorbed 0.3—10 keV flux (in erg cm-2 s-1) for the APEC spectrum indicated by the
WhichAPECfield. This is given byPeakRate_band0*APECECFU. - APECPeakUnabsFlux_pos
- The 1-σ positive error on the peak unabsorbed 0.3—10 keV flux for the APEC spectrum indicated by the
WhichAPECfield. This is given byPeakRate_band0_pos*APECECFU, so does not include uncertainties in the spectral modelling. - APECPeakUnabsFlux_neg
- The 1-σ negative error on the peak unabsorbed 0.3—10 keV flux for the APEC spectrum indicated by the
WhichAPECfield. This is given byPeakRate_band0_neg*APECECFU, so does not include uncertainties in the spectral modelling. - FixedPowECFO
- The counts-to-observed-flux (0.3—10 keV) conversion factor (in erg cm-2 ct-1) derived from a power-law spectrum with a photon index of 1.7
absorbed by the Galactic column (from the
GalacticNHfield). - FixedPowECFU
- The counts-to-unabsorbed-flux (0.3—10 keV) conversion factor (in erg cm-2 ct-1) derived from a power-law spectrum with a photon index of 1.7
absorbed by the Galactic column (from the
GalacticNHfield). - FixedPowFlux
- The observed 0.3—10 keV flux (in erg cm-2 s-1) derived from a power-law spectrum with a photon index of 1.7 absorbed by the Galactic column (from the
GalacticNHfield). This is given byRate_band0*FixedPowECFO. - FixedPowFlux_pos
- The 1-σ positive error on the observed 0.3—10 keV flux for a power-law spectrum with a photon index of 1.7 absorbed by the Galactic column (from the
GalacticNHfield). This is given byRate_band0_pos*FixedPowECFO, so does not include uncertainties in the spectral modelling. - FixedPowFlux_neg
- The 1-σ negative error on the observed 0.3—10 keV flux for a power-law spectrum with a photon index of 1.7 absorbed by the Galactic column (from the
GalacticNHfield). This is given byRate_band0_neg*FixedPowECFO, so does not include uncertainties in the spectral modelling. - FixedPowUnabsFlux
- The unabsorbed 0.3—10 keV flux (in erg cm-2 s-1) derived from a power-law spectrum with a photon index of 1.7 absorbed by the Galactic column (from the
GalacticNHfield). This is given byRate_band0*FixedPowECFU. - FixedPowUnabsFlux_pos
- The 1-σ positive error on the unabsorbed 0.3—10 keV flux for a power-law spectrum with a photon index of 1.7 absorbed by the Galactic column (from the
GalacticNHfield). This is given byRate_band0_pos*FixedPowECFU, so does not include uncertainties in the spectral modelling. - FixedPowUnabsFlux_neg
- The 1-σ negative error on the unabsorbed 0.3—10 keV flux for a power-law spectrum with a photon index of 1.7 absorbed by the Galactic column (from the
GalacticNHfield). This is given byRate_band0_neg*FixedPowECFU, so does not include uncertainties in the spectral modelling. - FixedAPECECFO
- The counts-to-observed-flux (0.3—10 keV) conversion factor (in erg cm-2 ct-1) derived from an APEC spectrum with a temperature of 1 keV
absorbed by the Galactic column (from the
GalacticNHfield). - FixedAPECECFU
- The counts-to-unabsorbed-flux (0.3—10 keV) conversion factor (in erg cm-2 ct-1) derived from an APEC spectrum with a temperature of 1 keV
absorbed by the Galactic column (from the
GalacticNHfield). - FixedAPECFlux
- The observed 0.3—10 keV flux (in erg cm-2 s-1) derived from an APEC spectrum with a temperature of 1 keV absorbed by the Galactic column (from the
GalacticNHfield). This is given byRate_band0*FixedAPEECECFO. - FixedAPECFlux_pos
- The 1-σ positive error on the observed 0.3—10 keV flux for an APEC spectrum with a temperature of 1 keV absorbed by the Galactic column (from the
GalacticNHfield). This is given byRate_band0_pos*FixedAPECECFO, so does not include uncertainties in the spectral modelling. - FixedAPECFlux_neg
- The 1-σ negative error on the observed 0.3—10 keV flux for an APEC spectrum with a temperature of 1 keV absorbed by the Galactic column (from the
GalacticNHfield). This is given byRate_band0_neg*FixedAPECECFO, so does not include uncertainties in the spectral modelling. - FixedAPECUnabsFlux
- The unabsorbed 0.3—10 keV flux (in erg cm-2 s-1) derived from an APEC spectrum with a temperature of 1 keV absorbed by the Galactic column (from the
GalacticNHfield). This is given byRate_band0*FixedAPECECFU. - FixedAPECUnabsFlux_pos
- The 1-σ positive error on the unabsorbed 0.3—10 keV flux for an APEC spectrum with a temperature of 1 keV absorbed by the Galactic column (from the
GalacticNHfield). This is given byRate_band0_pos*FixedAPECECFU, so does not include uncertainties in the spectral modelling. - FixedAPECUnabsFlux_neg
- The 1-σ negative error on the unabsorbed 0.3—10 keV flux for an APEC spectrum with a temperature of 1 keV absorbed by the Galactic column (from the
GalacticNHfield). This is given byRate_band0_neg*FixedAPECECFU, so does not include uncertainties in the spectral modelling. - InterpPowECFO
- The counts-to-observed-flux (0.3—10 keV) conversion factor (in erg cm-2 ct-1) derived from the hardness ratios of the source interpolated on a look-up table of power-law spectra.
- InterpPowECFU
- The counts-to-unabsorbed-flux (0.3—10 keV) conversion factor (in erg cm-2 ct-1) derived from the hardness ratios of the source interpolated on a look-up table of power-law spectra.
- InterpPowNH
- The absorption column (in cm-2) of the spectrum of the source derived from the hardness ratios of the source interpolated on a look-up table of power-law spectra.
- InterpPowNH_pos
- The 1-σ positive error absorption column of the spectrum of the source derived from the hardness ratios of the source interpolated on a look-up table of power-law spectra. A value of -1 indicates that this error could not be constrained.
- InterpPowNH_neg
- The 1-σ negative error absorption column of the spectrum of the source derived from the hardness ratios of the source interpolated on a look-up table of power-law spectra. A value of +1 indicates that this error could not be constrained.
- InterpPowGamma
- The power-law photon index of the spectrum of the source derived from the hardness ratios of the source interpolated on a look-up table of power-law spectra.
- InterpPowGamma_pos
- The 1-σ positive error on the power-law photon index of the spectrum of the source derived from the hardness ratios of the source interpolated on a look-up table of power-law spectra. A value of -1 indicates that this error could not be constrained.
- InterpPowGamma_neg
- The 1-σ negative error on the power-law photon index of the spectrum of the source derived from the hardness ratios of the source interpolated on a look-up table of power-law spectra. A value of +1 indicates that this error could not be constrained.
- InterpPowFlux
- The observed 0.3—10 keV flux (in erg cm-2 s-1) based on the HR-interpolated power-law spectrum.
This is given by
Rate_band0*InterpPowECFO. - InterpPowFlux_pos
- The 1-σ positive error on the observed 0.3—10 keV flux derived based on the HR-interpolated power-law spectrum.
This is given by
Rate_band0_pos*InterpPowECFO, so does not include uncertainties in the spectral modelling. - InterpPowFlux_neg
- The 1-σ negative error on the observed 0.3—10 keV flux derived based on the HR-interpolated power-law spectrum.
This is given by
Rate_band0_neg*InterpPowECFO, so does not include uncertainties in the spectral modelling. - InterpPowUnabsFlux
- The unabsorbed 0.3—10 keV flux (in erg cm-2 s-1) based on the HR-interpolated power-law spectrum.
This is given by
Rate_band0*InterpPowECFU. - InterpPowUnabsFlux_pos
- The 1-σ positive error on the unabsorbed 0.3—10 keV flux derived based on the HR-interpolated power-law spectrum.
This is given by
Rate_band0_pos*InterpPowECFU, so does not include uncertainties in the spectral modelling. - InterpPowUnabsFlux_neg
- The 1-σ negative error on the unabsorbed 0.3—10 keV flux derived based on the HR-interpolated power-law spectrum.
This is given by
Rate_band0_neg*InterpPowECFU, so does not include uncertainties in the spectral modelling. - InterpAPECECFO
- The counts-to-observed-flux (0.3—10 keV) conversion factor (in erg cm-2 ct-1) derived from the hardness ratios of the source interpolated on a look-up table of APEC spectra.
- InterpAPECECFU
- The counts-to-unabsorbed-flux (0.3—10 keV) conversion factor (in erg cm-2 ct-1) derived from the hardness ratios of the source interpolated on a look-up table of APEC spectra.
- InterpAPECNH
- The absorption column (in cm-2) of the spectrum of the source derived from the hardness ratios of the source interpolated on a look-up table of APEC spectra.
- InterpAPECNH_pos
- The 1-σ positive error absorption column of the spectrum of the source derived from the hardness ratios of the source interpolated on a look-up table of APEC spectra. A value of -1 indicates that this error could not be constrained.
- InterpAPECNH_neg
- The 1-σ negative error absorption column of the spectrum of the source derived from the hardness ratios of the source interpolated on a look-up table of APEC spectra. A value of +1 indicates that this error could not be constrained.
- InterpAPECkT
- The APEC plasma temperature (in keV) of the spectrum of the source derived from the hardness ratios of the source interpolated on a look-up table of APEC spectra.
- InterpAPECkT_pos
- The 1-σ positive error on the APEC plasma temperature of the spectrum of the source derived from the hardness ratios of the source interpolated on a look-up table of APEC spectra. A value of -1 indicates that this error could not be constrained.
- InterpAPECkT_neg
- The 1-σ negative error on the APEC plasma temperature of the spectrum of the source derived from the hardness ratios of the source interpolated on a look-up table of APEC spectra. A value of +1 indicates that this error could not be constrained.
- InterpAPECFlux
- The observed 0.3—10 keV flux (in erg cm-2 s-1) based on the HR-interpolated APEC spectrum.
This is given by
Rate_band0*InterpAPECECFO. - InterpAPECFlux_pos
- The 1-σ positive error on the observed 0.3—10 keV flux derived based on the HR-interpolated APEC spectrum.
This is given by
Rate_band0_pos*InterpAPECECFO, so does not include uncertainties in the spectral modelling. - InterpAPECFlux_neg
- The 1-σ negative error on the observed 0.3—10 keV flux derived based on the HR-interpolated APEC spectrum.
This is given by
Rate_band0_neg*InterpAPECECFO, so does not include uncertainties in the spectral modelling. - InterpAPECUnabsFlux
- The unabsorbed 0.3—10 keV flux (in erg cm-2 s-1) based on the HR-interpolated APEC spectrum.
This is given by
Rate_band0*InterpAPECECFU. - InterpAPECUnabsFlux_pos
- The 1-σ positive error on the unabsorbed 0.3—10 keV flux derived based on the HR-interpolated APEC spectrum.
This is given by
Rate_band0_pos*InterpAPECECFU, so does not include uncertainties in the spectral modelling. - InterpAPECUnabsFlux_neg
- The 1-σ negative error on the unabsorbed 0.3—10 keV flux derived based on the HR-interpolated APEC spectrum.
This is given by
Rate_band0_neg*InterpAPECECFU, so does not include uncertainties in the spectral modelling. - P_pow
- If the (HR1,HR2) values of the source lie inside the range allowed by the simple power-law spectrum, this field is 1. Otherwise it is the probability of obtaining the measured hardness ratios and errors if the true spectrum is that which gives (HR1,HR2) closest to the source's values.
- P_APEC
- If the (HR1,HR2) values of the source lie inside the range allowed by the simple APEC spectrum, this field is 1. Otherwise it is the probability of obtaining the measured hardness ratios and errors if the true spectrum is that which gives (HR1,HR2) closest to the source's values.
- FittedPowECFO
- The counts-to-observed-flux (0.3—10 keV) conversion factor (in erg cm-2 ct-1) derived from an automated power-law spectral fit to an automatically-extracted spectrum of the source.
- FittedPowECFU
- The counts-to-unabsorbed-flux (0.3—10 keV) conversion factor (in erg cm-2 ct-1) derived from an automated power-law spectral fit to an automatically-extracted spectrum of the source.
- FittedPowNH
- The absorption column (in cm-2) of the spectrum of the source from an automated power-law spectral fit to an automatically-extracted spectrum of the source.
- FittedPowNH_pos
- The 1-σ positive error absorption column of the spectrum of the source from an automated power-law spectral fit to an automatically-extracted spectrum of the source.
- FittedPowNH_neg
- The 1-σ negative error absorption column of the spectrum of the source from an automated power-law spectral fit to an automatically-extracted spectrum of the source.
- FittedPowGamma
- The power-law photon index of the spectrum of the source from an automated power-law spectral fit to an automatically-extracted spectrum of the source.
- FittedPowGamma_pos
- The 1-σ positive error on the power-law photon index of the spectrum of the source from an automated power-law spectral fit to an automatically-extracted spectrum of the source.
- FittedPowGamma_neg
- The 1-σ negative error on the power-law photon index of the spectrum of the source from an automated power-law spectral fit to an automatically-extracted spectrum of the source.
- FittedPowFlux
- The observed 0.3—10 keV flux (in erg cm-2 s-1) derived from an automated power-law spectral fit to an automatically-extracted spectrum of the source.
This is given by
Rate_band0*FittedPowECFO. - FittedPowFlux_pos
- The 1-σ positive error on the observed 0.3—10 keV flux derived from an automated power-law spectral fit to an automatically-extracted spectrum of the source.
This is given by
Rate_band0_pos*FittedPowECFO, so does not include uncertainties in the spectral modelling. - FittedPowFlux_neg
- The 1-σ negative error on the observed 0.3—10 keV flux derived from an automated power-law spectral fit to an automatically-extracted spectrum of the source.
This is given by
Rate_band0_ne*FittedPowECFO, so does not include uncertainties in the spectral modelling. - FittedPowUnabsFlux
- The unabsorbed 0.3—10 keV flux (in erg cm-2 s-1) derived from an automated power-law spectral fit to an automatically-extracted spectrum of the source.
This is given by
Rate_band0*FittedPowECFO. - FittedPowUnabsFlux_pos
- The 1-σ positive error on the unabsorbed 0.3—10 keV flux derived from an automated power-law spectral fit to an automatically-extracted spectrum of the source.
This is given by
Rate_band0_pos*FittedPowECFU, so does not include uncertainties in the spectral modelling. - FittedPowUnabsFlux_neg
- The 1-σ negative error on the unabsorbed 0.3—10 keV flux derived from an automated power-law spectral fit to an automatically-extracted spectrum of the source.
This is given by
Rate_band0_neg*FittedPowECFU, so does not include uncertainties in the spectral modelling. - FittedPowCstat
- The Cstatistic from the power-law spectral fit.
- FittedPowDOF
- The number of degrees of freedom in the power-law spectral fit.
- FittedPowRedChi
- The Churazov-weighted χν2 value of the best fitting power-law spectral model.
- FittedAPECECFO
- The counts-to-observed-flux (0.3—10 keV) conversion factor (in erg cm-2 ct-1) derived from an automated APEC spectral fit to an automatically-extracted spectrum of the source.
- FittedAPECECFU
- The counts-to-unabsorbed-flux (0.3—10 keV) conversion factor (in erg cm-2 ct-1), derived from an automated APEC spectral fit to an automatically-extracted spectrum of the source.
- FittedAPECNH
- The absorption column (in cm-2) of the spectrum of the source derived from an automated APEC spectral fit to an automatically-extracted spectrum of the source.
- FittedAPECNH_pos
- The 1-σ positive error absorption column of the spectrum of the source derived from an automated APEC spectral fit to an automatically-extracted spectrum of the source.
- FittedAPECNH_neg
- The 1-σ negative error absorption column of the spectrum of the source derived from an automated APEC spectral fit to an automatically-extracted spectrum of the source.
- FittedAPECkT
- The APEC plasma temperature (in keV) of the spectrum of the source derived from an automated APEC spectral fit to an automatically-extracted spectrum of the source.
- FittedAPECkT_pos
- The 1-σ positive error on the APEC plasma temperature of the spectrum of the source derived from an automated APEC spectral fit to an automatically-extracted spectrum of the source.
- FittedAPECkT_neg
- The 1-σ negative error on the APEC plasma temperature of the spectrum of the source derived from an automated APEC spectral fit to an automatically-extracted spectrum of the source.
- FittedAPECFlux
- The observed 0.3—10 keV flux (in erg cm-2 s-1) derived from an automated APEC spectral fit to an automatically-extracted spectrum of the source.
This is given by
Rate_band0*FittedAPECECFO. - FittedAPECFlux_pos
- The 1-σ positive error on the observed 0.3—10 keV flux derived from an automated APEC spectral fit to an automatically-extracted spectrum of the source.
This is given by
Rate_band0_pos*FittedAPECECFO, so does not include uncertainties in the spectral modelling. - FittedAPECFlux_neg
- The 1-σ negative error on the observed 0.3—10 keV flux derived from an automated APEC spectral fit to an automatically-extracted spectrum of the source.
This is given by
Rate_band0_ne*FittedAPECECFO, so does not include uncertainties in the spectral modelling. - FittedAPECUnabsFlux
- The unabsorbed 0.3—10 keV flux (in erg cm-2 s-1) derived from an automated APEC spectral fit to an automatically-extracted spectrum of the source.
This is given by
Rate_band0*FittedAPECECFO. - FittedAPECUnabsFlux_pos
- The 1-σ positive error on the unabsorbed 0.3—10 keV flux derived from an automated APEC spectral fit to an automatically-extracted spectrum of the source.
This is given by
Rate_band0_pos*FittedAPECECFU, so does not include uncertainties in the spectral modelling. - FittedAPECUnabsFlux_neg
- The 1-σ negative error on the unabsorbed 0.3—10 keV flux derived from an automated APEC spectral fit to an automatically-extracted spectrum of the source.
This is given by
Rate_band0_neg*FittedAPECECFU, so does not include uncertainties in the spectral modelling. - FittedAPECCstat
- The Cstatistic from the APEC spectral fit.
- FittedAPECDOF
- The number of degrees of freedom in the APEC spectral fit.
- FittedAPECRedChi
- The Churazov-weighted χν2 value of the best fitting APEC spectral model.
- HasSpec
- Whether there is (1) or is not (0) an automatically-built spectrum for this source.
[Hide spectral/flux columns | Back to Sources table | Back to top | 2SXPS index]
Cross-correlation information
There are 16 columns in this group. Show.
- Numxcorr
- The number of sources in the external catalogues against which we performed cross-correlation, which agree spatially at the 3-σ level.
- Numxcorr_slim
- The number of sources in the external catalogues against which we performed cross-correlation, which agree spatially at the 3-σ level, excluding the 2MASS, USNO-B1 and ALLWISE caltalogues.
- MatchInROSHRI
- Whether the object does (1) or does not (0) match an object in the Rosat HRI catalogue.
- MatchIn2RXS
- Whether the object does (1) or does not (0) match an object in the 2RXS catalogue.
- MatchIn3XMMDR8
- Whether the object does (1) or does not (0) match an object in the 3XMM-DR8 catalogue.
- MatchIn3XMMDR8_Stack
- Whether the object does (1) or does not (0) match an object in the 3XMM-DR7 catalogue.
- MatchInXMMSL2
- Whether the object does (1) or does not (0) match an object in the XMMSL2 catalogue.
- MatchInSwiftFT
- Whether the object does (1) or does not (0) match an object in the SwiftFT catalogue.
- MatchIn1SWXRT
- Whether the object does (1) or does not (0) match an object in the 1SWXRT catalogue.
- MatchInXRTGRB
- Whether the object does (1) or does not (0) match a catalogued XRT position of a Gamma Ray Burst.
- MatchInSDSSQSO
- Whether the object does (1) or does not (0) match an object in the SDSS QSO DR14 catalogue.
- MatchIn2MASS
- Whether the object does (1) or does not (0) match a 2MASS source.
- MatchInUSNOB1
- Whether the object does (1) or does not (0) match a USNO-B1 source.
- MatchIn2CSC
- Whether the object does (1) or does not (0) match an object in the 2CSC (Chandra) catalogue.
- MatchIn1SXPS
- Whether the object does (1) or does not (0) match an object in the 1SXPS catalogue.
- MatchInALLWISE
- Whether the object does (1) or does not (0) match an object in the ALLWISE catalogue.
[Hide cross-correlation columns | Back to Sources table | Back to top | 2SXPS index]
Datasets Table
The Datasets table contains information about individual datasets — observations and stacked images — which make up the 2SXPS catalogue.
- ObsID
- The Swift obsID of this dataset. Values >1010 are stacked images.
- FieldFlag
- The warning flag associated with this dataset. This is a bitwise flag with the following values:
Bit Value Description 0 1 Field contains stray light. 1 2 Field contains diffuse emission or artifacts. 2 4 Field contains stray light that could not be adequately modelled. 3 8 Field contains a bright, piled up source which was not properly fitted in some bands. 5 32 Screening of artifacts may contain an error. See explanation. - RA
- The Right Ascension (J2000.0) of the image centre in degrees.
- Decl
- The Right Ascension (J2000.0) of the image centre in degrees.
- l
- The Galactic longitude of the image centre in degrees.
- b
- The Galactic latitude of the image centre in degrees.
- ImageSize
- The side length of the dataset image, in XRT pixels (1 pixel = 2.357″).
- ExposureUsed
- The total exposure time of the dataset, after filtering, in seconds.
- OriginalExposure
- The total exposure time of the dataset, before filtering, in seconds.
- StartTime_MET
- The start time of the dataset in Swift MET.
- StopTime_MET
- The end time of the dataset in Swift MET.
- MidTime_MET
- The mid-time of the dataset in Swift MET.
- MidTime_TDB
- The mid-time of the dataset in TDB.
- MidTime_MJD
- The mid-time of the dataset in MJD.
- StartTime_UTC
- The start time of the dataset as a UTC calendar date/time.
- StopTime_UTC
- The end time of the dataset as a UTC calendar date/time.
- FieldBG_band0
- The mean background value in the total (0.3—10 keV) band in ct s-1 pix-1. This is measured from the background map before the detected sources have been added to it.
- Field BG_band1
- The mean background value in the soft (0.3—1 keV) band in ct s-1 pix-1. This is measured from the background map before the detected sources have been added to it.
- Field BG_band2
- The mean background value in the medium (1—2 keV) band in ct s-1 pix-1. This is measured from the background map before the detected sources have been added to it.
- Field BG_band3
- The mean background value in the hard (2—10 keV) band in ct s-1 pix-1. This is measured from the background map before the detected sources have been added to it.
- Numsrc_band0
- The number of sources detected in the total (0.3—10 keV) band image of this dataset.
- NumOK_band0
- The number of Good and Reasonable sources detected in the total (0.3—10 keV) band image of this dataset.
- MedianNNDist_band0
- The median distance between sources detected in the total (0.3—10 keV) band image of this dataset, in arc seconds.
- Numsrc_band1
- The number of sources detected in the soft (0.3—1 keV) band image of this dataset.
- NumOK_band1
- The number of Good and Reasonable sources detected in the soft (0.3—1 keV) band image of this dataset.
- MedianNNDist_band1
- The median distance between sources detected in the soft (0.3—1 keV) band image of this dataset, in arc seconds.
- Numsrc_band2
- The number of sources detected in the medium (1—2 keV) band image of this dataset.
- NumOK_band2
- The number of Good and Reasonable sources detected in the medium (1—2 keV) band image of this dataset.
- MedianNNDist_band2
- The median distance between sources detected in the medium (1—2 keV) band image of this dataset, in arc seconds.
- Numsrc_band3
- The number of sources detected in the hard (1—10 keV) band image of this dataset.
- NumOK_band3
- The number of Good and Reasonable sources detected in the hard (1—10 keV) band image of this dataset.
- MedianNNDist_band3
- The median distance between sources detected in the hard (2—10 keV) band image of this dataset, in arc seconds.
- NumberOfSnapshots
- The number of snapshots in the dataset.
- AstromErr
- If the astrometry of this image could be determined by matching the XRT sources with the 2MASS catalogue, this gives the 90% confidence radial error associated with that astrometry.
- CRVAL1_corr
- The
CRVAL1WCS reference value for the dataset derived from the XRT-2MASS astrometric solution. - CRVAL2_corr
- The
CRVAL2WCS reference value for the dataset derived from the XRT-2MASS astrometric solution. - CROTA_2_corr
- The
CROTA_2WCS reference value for the dataset derived from the XRT-2MASS astrometric solution.
Detections Table
The Detections table contains details of the specific detections that comprise the catalogue. Each source in the Sources table has at least one entry in this detections table; most sources have multiple entries as they were detected in more than one band or dataset. The information in the detections table relates to the specific detection, not to the unique source as a whole. The fields in this table, and their definitions are given below.
- DetectionID
- The unique identifier of this detection.
- 2SXPS_ID
- The
2SXPS_IDvalue in the sources table of the unique source to which this detection relates. - SourceNo
- The identifier of this detection within the specific dataset and energy band in which it occurred.
- Band
- The band in which this detection occurred, as an integer:
Value Band name Energy range 0 Total 0.3— 10 keV 1 Soft 0.3— 1 keV 2 Medium 1— 2 keV 3 Hard 2— 10 keV - ObsID
- The Swift obsID of this dataset. Values >1010 are stacked images. This corresponds to an entry in the ‘Datasets’ table.
- CorrectedExposure
- The actual exposure in this dataset at the position of this detection.
- ExposureFraction
- The fractional exposure at the position of this detection; that is, the
CorrectedExposurevalue divided by the nominal exposure of the dataset. - OffAxisAngle
- The mean angular distance of the detection from the XRT boresight, in arc minutes, in this specific dataset and energy band. This is calculated only from the snapshots during which source is inside the field of view. A value of -1 indicates that the source centre is never in the field of view (i.e. it was detected and localised via the PSF wings).
- RA
- The Right Ascension (J2000) of this detection, using the astrometry from the on-board star trackers, in decmial degrees.
- RA_pos
- The 1-σ positive uncertainty on the RA, in decimal degrees.
- RA_neg
- The 1-σ negative uncertainty on the RA, in decimal degrees.
- Decl
- The declination (J2000) of this detection, using the astrometry from the on-board star trackers, in decmial degrees.
- Decl_pos
- The 1-σ positive uncertainty on the declination, in decimal degrees.
- Decl_neg
- The 1-σ negative uncertainty on the declination, in decimal degrees.
- Err90
- The 90% confidence radial position error, including systematic error, using the astrometry from the on-board star trackers. This is derived from the RA and Decl errors above and has been converted to 90% confidence using Rayleigh statistics, with the 3.5′′ astrometric systematic error from the star trackers added in quadrature. For the sources where one of the individual RA/Dec pos/neg errors was unavailable, the statistical radial 90% confidence error was set to be 11.301′′/√N (where N is the number of events used in the PSF fit) and the systematic error was combined with this.
- RA_corrected
- The Right Ascension (J2000) of this detection, using the XRT-2MASS astrometry, in decimal degrees.
- Decl_corrected
- The declination (J2000) of this detection, using the XRT-2MASS astrometry, in decimal degrees.
- Err90_corrected
- The 90% confidence radial position error, derived as for the
Err90field above, but where the systematic error is taken from the X-ray/2MASS rectification process and not the on-board star trackers. - l
- Galactic longitude of the detection, based on the star tracker astrometry, in decimal degrees.
- b
- Galactic latitude of the detection, based on the star tracker astrometry, in decimal degrees.
- l_corrected
- Galactic longitude of the detection, based on the XRT-2MASS astrometry, in decimal degrees.
- b_corrected
- Galactic latitude of the detection, based on the XRT-2MASS astrometry, in decimal degrees.
- IMG_X
- The
skyx position of the source in the specific dataset and energy band shown. - IMG_Y
- The
skyy position of the source in the specific dataset and energy band shown. - NearestNeighbour
- The distance in arc seconds to the nearest source also detected in this dataset and energy band. If no other sources are detected this is -1.
- NearestOKNeighbour
- The distance in arc seconds to the nearest source flagged as Good or Reasonable also detected in this dataset and energy band. If no such sources are detected this is -1.
- DetFlag
- The detection flag from this specific detections.
The basic values are 0, 1, or 2, meaning Good, Reasonable or Poor respectively.
Higher values mean that an extra warning is associated with the source.
This warning is bitwise, defined as follows:
Bit Value Description 2 4 The source position is consistent with that of a known extended source. 3 8 The source is likely an alias of a badly-fitted piled up source. 4 16 The source lies in a region marked as contaminated during the visual screening. - OpticalLoadingWarning
- If an optical source exists near the detection, and is bright enough to cause optical loading then this field indicates how many magnitudes brighter than the optical loading limit that source is, otherwise it is zero.
- StrayLightWarning
- This is set to one if the detections occured within 30 pixels of fitted stray light emission, otherwise zero.
- NearBrightSourceWarning
- This is set to one if the background level at the detection location exceeded 10-3 ct s-1 pixel-1, i.e. was likely in the wings of a bright source, otherwise zero.
- MatchesKnownExtended
- Whether the position of this detection matches that of a known extended source.
- PileupFitted
- Whether pile up was deemed necessary, and therefore the parameters reported come from the piled up fit.
- SNR
- The signal-to-noise ratio of the detection (from the cell-detect pass).
- CtsInPSFFit
- The number of counts in the image in the region over which the final PSF fit was performed. This will include counts from the source and background.
- BGRateInPSFFit
- The mean count-rate in the background map in the region over which the final PSF fit was performed.
- Cstat
- The Cstat from the final PSF, from which the detection parameters were taken.
- Cstat_nosrc
- The Cstat calculated assuming no source was present.
- L_src
- The likelihood value that this is a real source, not a background fluctuation.
- Cstat_flat
- The Cstat calculated assuming a spatially uniform increase above the background.
- Lflag
- The likelihood value associated with Cstat_flat
- FracPix
- The fraction of the pixels within the PSF fit region which were exposed.
- Pileup_S
- The best-fitting S value of the pile up model. This is reported even if the pile up fit was not deemed to be an improvement and was not used.
- Pileup_l
- The best-fitting l value of the pile up model. This is reported even if the pile up fit was not deemed to be an improvement and was not used.
- Pileup_c
- The best-fitting c value of the pile up model. This is reported even if the pile up fit was not deemed to be an improvement and was not used.
- Pileup_tau
- The best-fitting τ value of the pile up model. This is reported even if the pile up fit was not deemed to be an improvement and was not used.
- Cstat_altPileup
- The Cstat from the PSF fit which was not used. That is, if
PileupFittedis 1 (the pile up fit was used) this column contains the Cstat obtained from the non-piled-up fit, and vice versa. - PSF_Fit_Radius
- The radius of the circular region over which PSF fitting was carried out, in XRT pixels (1 pixel = 2.357″)
- CellDetect_BoxWidth
- The full width of the cell-detect box in which this object was detected, and for which the
SNRvalue was computed, in XRT pixels. - Rate
- The mean count rate of this detection (i.e. in this dataset and band), corrected for pile up, vignetting, bad columns etc.
- Rate_pos
- The 1-σ positive uncertainty on the count-rate.
- Rate_neg
- The 1-σ negative uncertainty on the count-rate.
- CtsInRate
- The total number of counts in the image in the region used to determine the count-rate.
- BgCtsInRate
- The total number of counts in the background map in the region used to determine the count-rate.
- Rate_CF
- The PSF correction factor used to correct the count rate for pile up, vignetting, bad columns etc.
- BGRateinRate
- The mean background count-rate at the position of the detection.
- OrigErr90
- In the initial release of 2SXPS the statsitical component of the error was a factor of 1.5 too large, due to an error in the conversion from 1-σ to 90% confidence. This has now been corrected, however the value originally released (and used in cross correlation) is given in this field.
- OrigErr90_corrected
- As OrigErr90, but the astrometrically corrected (using XRT and 2MASS) version.
Cross Correlations Table
The Cross correlations table contains details of the cross correlation between the 1SXPS sources and other catalogues.
- 2SXPS_ID
- The ID of the 2SXPS source.
- ExtCat_ID
- The name of the matched source in the external catalogue.
- Catalogue
- The name of the catalogue in which the match occurs.
- Distance
- The distance, in arc seconds, between the 2SXPS source and the external catalogue source.
- RA
- The Right Ascension (J2000), in decimal degrees, of the source in the external catalogue.
- Decl
- The declination (J2000), in decimal degrees, of the source in the external catalogue.
- Err90
- The 90% confidence radial error in the external catalogue position (if available). Where necessary, this has been converted from a 1-σ error using Rayleigh statistics, and has had any relevant systematic error added.
Known issues and problems
While every attempt was made to guarantee the accuracy of all of the data in this catalogue, some issues have since been identified, and where possible, mitigated. These are detailed below.
- Incorrect flagging of some sources affected by diffuse emission.
- For fields in which areas of diffuse emission or artifacts were identified by human inspection and described by an elliptical region, the flagging of sources was incorrect. The elliptical region applied to identify affected sources was rotated by 90° compared to the correct orientation. Thus, some detections in those fields have a DetFlag value with bit 4 incorrectly (un)set. Affected fields have bit 5 (value 32) set in their FieldFlag. This issue has been fixed for future catalogues.
- Poor pile-up correction in some light-curve bins.
- In a small number of cases, the pile up fitting to the soft, medium or hard energy bands is unreliable, to a degree that the count-rate in a specific observation and band is unreliable. This is simply a result of the stochastic nature of fitting pile up and determining whether the piled-up or non-piled up fit is better. There are two problematic cases: when an object is found to be piled up in a sub-band but not the total band; or the pile-up correction factors in the total band and the sub-band differ by more than 50%. In these cases the light curve bin is flagged, and by default is excluded from the light curve displayed / downloaded; you have to specifically request to include these bins.
- Source blending in crowded fields
- The process of identifying unique sources is a two-step process. The first step merges detections across the different bands within the same dataset into a list of unique objects in that dataset. In the second step, these “obsSources” are merged across all datasets into a unique source list. An error has been identified in the first step, whereby distinct by nearby detections in the same band can associated with the same object: being distinct detections in the same band they must, in fact, be distinct objects. This means that the number of sources in the catalogue is slightly underestimated. This issue has been fixed for future catalogues.
UK Swift Science Data Centre
Last updated 2019 November 12
Web page maintained by Phil Evans
E-mail: swift help
Please read our privacy notice.