- Home
- About
- Support
- Data Access
- Data Analysis
- Data Products
- Publications
-
Links
Databases NED Simbad GCN circulars archive GRB data table Software & Tools Swift Software (HEASoft) Xanadu WebPIMMS Institutional Swift Sites GSFC PSU OAB SSDC MSSL University of Leicester
Creating light-curves
The uvotmaghist tool uses uvotsource on all the given extensions of an image to create a light curve.
> uvotmaghist
Name of input image file[ ]: sw00374210000uuu_sk.img.gz
Name for output magnitude history[ ]: maghistU.fits
Name for output magnitude history plot or NONE[ ]: maghistU.gif
Source region file or NONE[ ]: Usource.reg
Background region file or NONE[ ]: Uback.reg
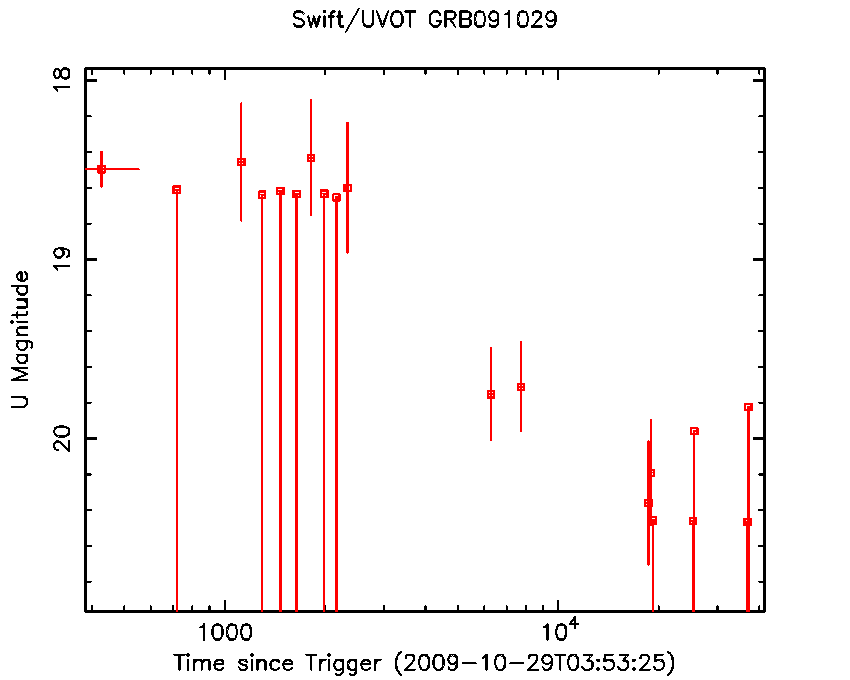
The gif output file is a plot of magnitudes with time, though this can be changed using the plotcol command. One point will be plotted for each extension of the image. If any of these are non-detections (at the 3-sigma level, by default), the point will be plotted with just a negative error bar, as in the following example:
The FITS file output contains a table of those magnitudes and errors plus count rates and fluxes. Thus, the user can make their own plot, rather than using the one produced automatically by uvotmaghist.
See the comment at the bottom of the uvotsource page about possible sensitivity issues.
If event mode data are available, then light-curves on a finer timescale can be created. The UVOT Software Guide (Section 2.2) explains how to clean the event list; note that event mode data cannot be directly aspect corrected, so the extraction region may need to be adjusted by eye. A light-curve can then be created using uvotevtlc (see fhelp uvotevtlc for details).