- Home
- About
- Support
- Data Access
- Data Analysis
- Data Products
- Publications
-
Links
Databases NED Simbad GCN circulars archive GRB data table Software & Tools Swift Software (HEASoft) Xanadu WebPIMMS Institutional Swift Sites GSFC PSU OAB SSDC MSSL University of Leicester

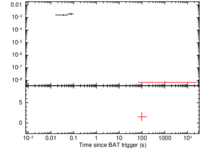
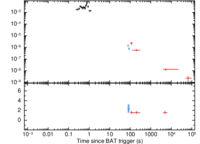


Burst Analyser — BAT-XRT-UVOT light curves
Due to planned network maintenance, there may be interruptions to the www.swift.ac.uk website and related services on Tuesday 21st July 2026. This work is part of routine but essential infrastructure maintenance. We apologise for any inconvenience.
This website contains BAT, XRT and UVOT fluxed light curves of all GRBs observed by Swift. The flux conversion is time-dependant and accounts for spectral evolution. See the online documentation for details
In January 2016 the Burst Analyser was modified to include a new plot: the observed flux density. This plot, which includes UVOT data when available, is the first plot on the individual target pages. See the online documentation for details.
NEW: Guidelines for downloading XRT GRB products in bulk.
Select a GRB:
Either choose a recent GRB from the thumbnails above or use one of the options below.
1) Thumbnails of all bursts: flux density (10 keV) | flux (0.3-10 keV) | flux (15-50 keV).
Usage
If using these products please cite Evans et al. 2010, and use this acknowledgment.
UK Swift Science Data Centre
Last updated 2011 March 29
Web page maintained by Phil Evans
E-mail: swift help
Please read our privacy notice.