- Home
- About
- Support
- Data Access
- Data Analysis
- GRB Products
- Publications
-
Links
Databases NED Simbad GCN circulars archive GRB data table Software & Tools Swift Software (HEASoft) Xanadu WebPIMMS Institutional Swift Sites GSFC PSU OAB SSDC MSSL University of Leicester
TILED_GRB00016
GRB
GRB 130518A: Swift observation summary
| Mission: | Fermi/LAT |
|---|---|
| GRB RA: | 355.809° |
| GRB Dec: | +47.641° |
| GRB Err: | 18.0 arcmin |
| T0: | 2013-05-18 13:54:26 UT |
| Galactic: | 111.20° -13.67° |
| Galactic NH: | 1.03× 1021 cm-2 |
| Galactic E(B-V): | NED unavailable |
| Sun distance: | 55.35° |
|---|---|
| Sun angle: | 3.98 [hr] (West of Sun) |
| Moon distance: | 122.63° |
| Visibility of this field. | |
Source 1 has been manually confirmed as the GRB afterglow; data for this object are now available through the main GRB results area for this GRB.
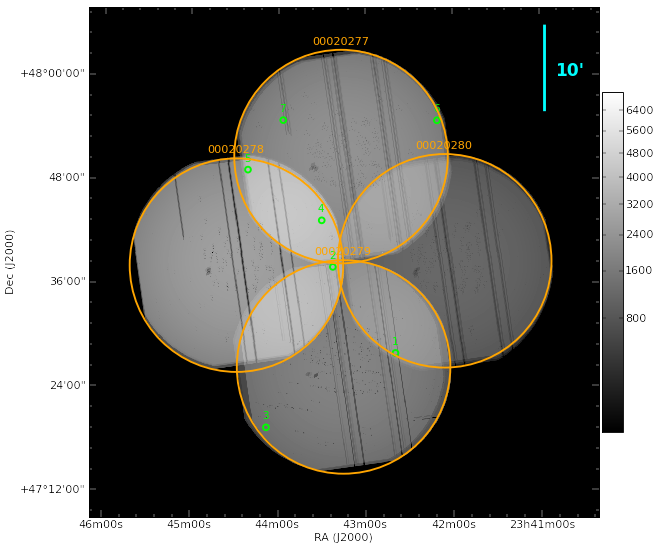
So far 4 fields have been scheduled for observations. Data are available and processed for 4 of these. The list gives the exposure time used in source detection. If any individual sources were selected for follow-up observations, the source detection is not repeated for the follow up observations and the table below is not updated.
- 20277 — 2.3 ks of cleaned data taken between 2013-05-18 22:09:22 and 2013-05-19 06:40:24
- 20278 — 2.8 ks of cleaned data taken between 2013-05-18 22:19:09 and 2013-05-19 06:36:25
- 20279 — 1.9 ks of cleaned data taken between 2013-05-18 22:28:55 and 2013-05-19 06:32:11
- 20280 — 1.2 ks of cleaned data taken between 2013-05-18 23:55:46 and 2013-05-19 06:27:47
Probable afterglow details
A source was found which matches the afterglow criteria.
| # | RA (J2000) | Dec (J2000) | Err901 | Detection Flag2 |
Dist from LAT pos |
Exposure | Notes | Vizier |
|---|---|---|---|---|---|---|---|---|
| 1 [details] |
23h 42m 40.23s | +47° 27′ 53.9″ | 2.2′′ * | Good | 12.0′ | 2.4 ks | The source is brighter than the RASS limit. |  |
1 Radius, 90% confidence.
2 Indicates how likely the source is to be real. See the 1SXPS documentation.
* The position was enhanced using astrometry derived from the Swift UVOT.
† The position was astrometrically corrected using the XRT sources and the 2MASS catalogue.
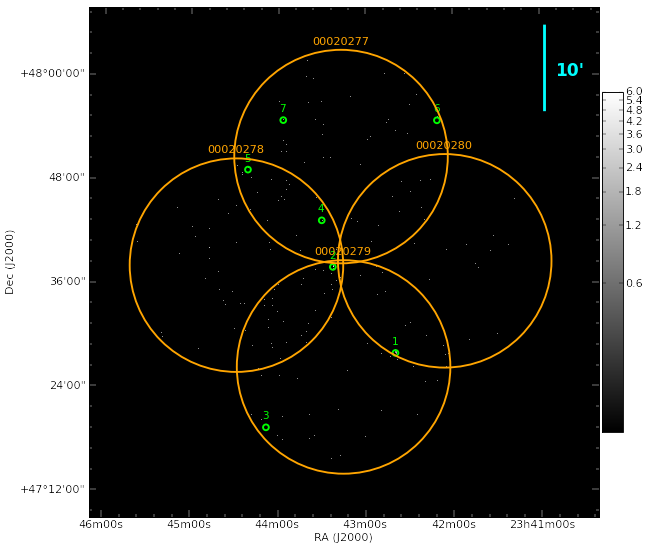
Sources found so far
So far 7 sources have been found in the XRT data. 1 sources match catalogued sources.
| # | RA (J2000) | Dec (J2000) | Err901 | Detection Flag2 |
Dist from LAT pos |
Exposure | Notes | Vizier |
|---|---|---|---|---|---|---|---|---|
| 1 [details] |
23h 42m 40.23s | +47° 27′ 53.9″ | 2.2′′ * | Good | 12.0′ | 2.4 ks | The source is brighter than the RASS limit. | |
| 2 [details] |
23h 43m 22.95s | +47° 37′ 49.8″ | 2.5′′ * | Good | 1.6′ | 3.2 ks | A catalogued X-ray source matches this source's position: (Show) | |
| 3 [details] |
23h 44m 08.10s | +47° 19′ 17.1″ | 4.8′′ | Good | 21.2′ | 1.4 ks | |
|
| 4 [details] |
23h 43m 30.18s | +47° 43′ 12.8″ | 5.8′′ | Good | 5.5′ | 4.2 ks | |
|
| 5 [details] |
23h 44m 20.97s | +47° 49′ 03.3″ | 6.1′′ | Good | 15.4′ | 3.8 ks | |
|
| 6 [details] |
23h 42m 10.81s | +47° 54′ 45.1″ | 5.7′′ | Good | 19.5′ | 1.6 ks | |
|
| 7 [details] |
23h 43m 56.75s | +47° 54′ 47.1″ | 5.8′′ | Good | 17.8′ | 1.8 ks | |
1 Radius, 90% confidence.
2 Indicates how likely the source is to be real. See the 1SXPS documentation.
* The position was enhanced using astrometry derived from the Swift UVOT.
† The position was astrometrically corrected using the XRT sources and the 2MASS catalogue.
Image
Exposure map
UK Swift Science Data Centre
Last updated 2015 Jan 26 at 13:13:08 UT
Web page maintained by Phil Evans
E-mail: swift help
Please read our privacy notice.